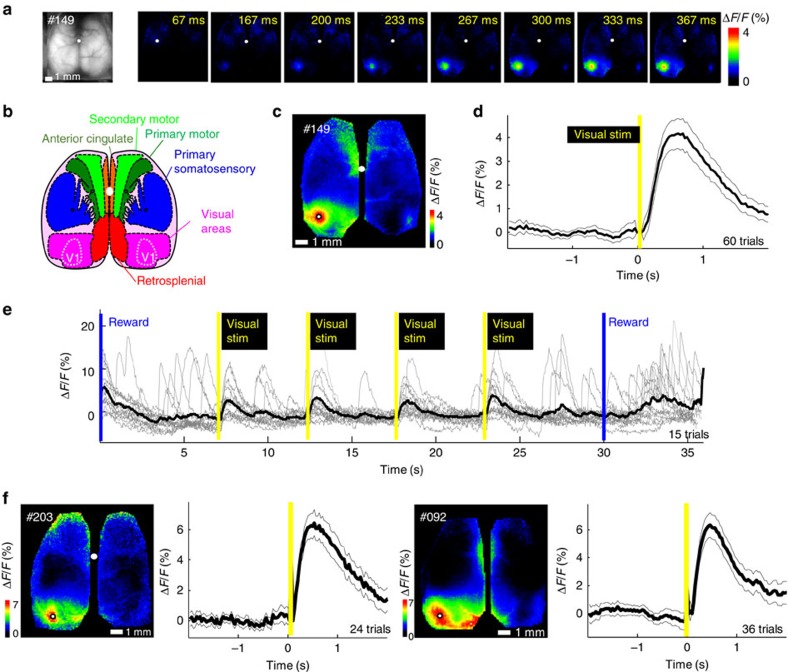
Figure 5. Consistent evoked visual responses observed within visual cortex of auto-head-fixed mouse cortex.
(a) A raw epi-fluorescence image (left most) followed by a montage of averaged response (%ΔF/F0) following visual stimulation of the right eye (10 ms yellow LED flash placed anterior of mouse; yellow bars indicate flash stimulus) for Ai94 GCaMP6 mice from cage GU. (b) Atlas of the dorsal region of the cortex (adapted from the Allen Mouse Brain Connectivity Atlas). (c) Map of the maximum response (ΔF/Fo). (d) Profile of the averaged response within a pixel located in V1 (see white dot in c marking maximal response) with SEM across trials indicated (mouse #0149) ΔF/F0 4.9±0.6% (P=1.8232e−5, t-test, n=60 versus baseline variation), flash stimulus delivered at the yellow bar. (e) Single trials (grey lines) from the same pixel as c are overlayed before averaging (black line) for each visual stimulation (15 trials with four flashes each were averaged for n=60). (f) More examples of averaged responses from two other mice (mouse #0203 ΔF/F0 7.6±0.8% P=0.00010218, n=24 and mouse #0092 7.3±0.8%, P=4.9089e−5, n=36), the cranial windows for these mice were made 34–40 days before the experiment. No correction for intra-trial movement was necessary in these datasets, the white dots mark the bregma landmark.

