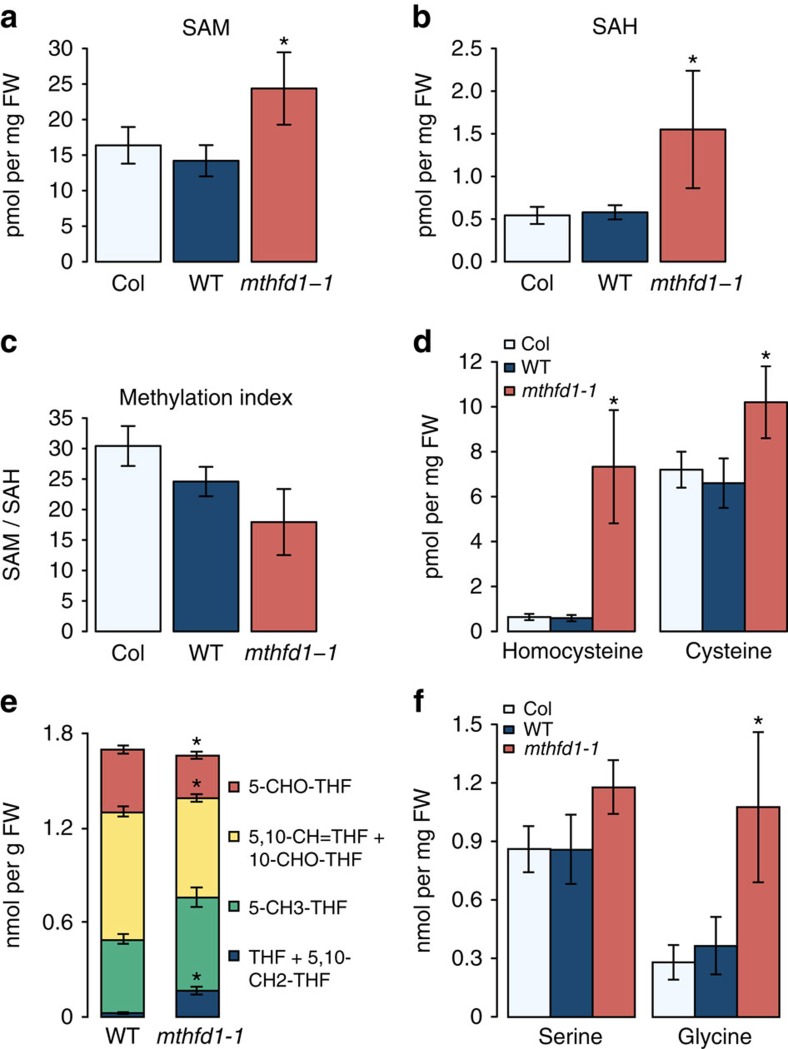
Figure 7. mthfd1-1 mutants show impaired one-carbon cycle.
(a–f) Steady-state levels of SAM (a), SAH (b), Methylation Index (MI) (c), selected thiols (d), folates (e) and selected amino acids (f) in leaves of Col, WT and the mthfd1-1 mutant. Data represent means±SD. Asterisks indicate significant differences determined by Student's t-test (P<0.05, n≥3).

