
Figure 10.
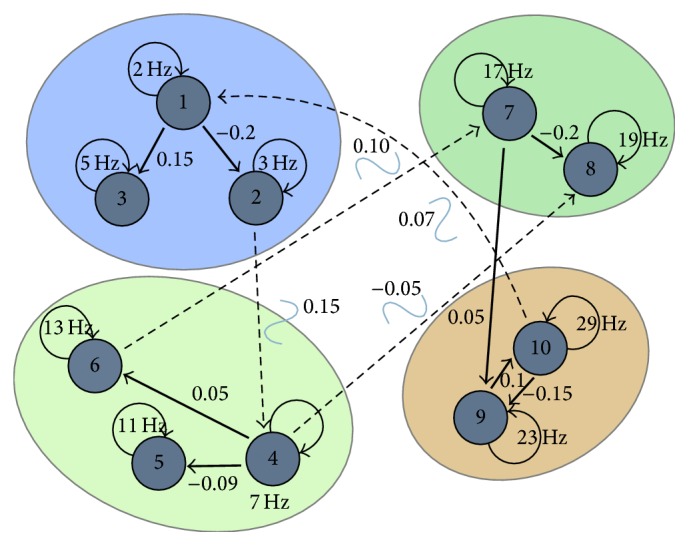
A graphical depiction of coupling dependencies in the 10-source vector AR(2) model. Each circle represents a generated source modeled by a damped harmonic oscillator with a given fundamental frequency, randomized damping coefficients, and coupling terms depicted by the connecting lines. Solid black lines indicate a static first-order dependency with coupling coefficient denoted in the direction of the arrow. Dashed lines indicate a second-order dependency. The second-order couplings vary dynamically according to a sinusoidal function with frequencies varying between 0.1 and 1 Hz and amplitudes denoted in the figure.