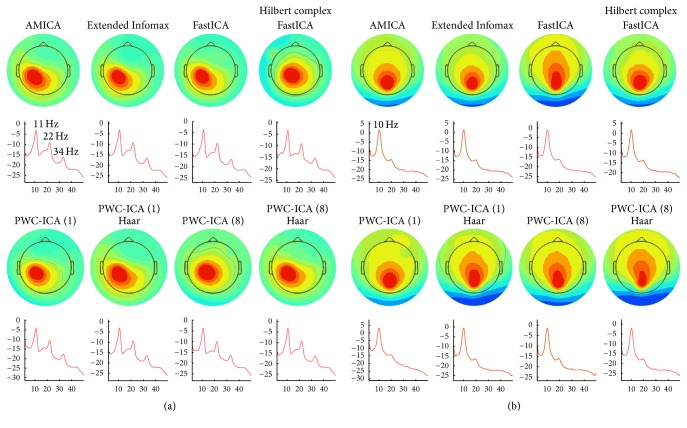
Figure 9.
Single components corresponding to (a) left mu rhythm and (b) alpha band activity in subject 2 of the datasets provided by Delorme et al. [9]. The top plot in each case depicts a scalp map associated with the component, and the bottom plot is the mean activity spectra, with the horizontal axis measuring frequency (Hz) and the vertical axis measuring power in units of 10 log10 μV2/Hz.

