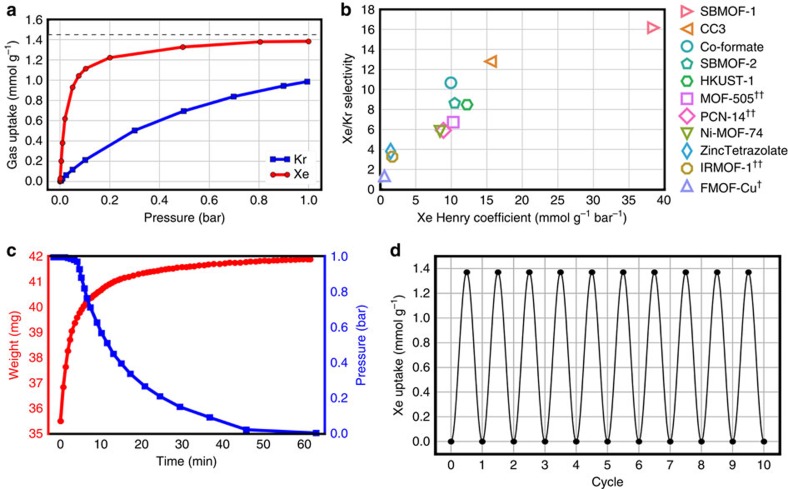
Figure 2. Experimental characterization of Xe and Kr adsorption in SBMOF-1.
(a) Experimental Xe and Kr adsorption isotherms. Horizontal line indicates one atom per pore segment. (b) Survey of thermodynamic Xe/Kr separation performance in top-performing materials. Henry coefficients are extracted from pure-component Xe and Kr adsorption isotherms reported in the literature (see Methods). Data at 298 K, exceptions denoted by a dagger (†) for 297 K and a double dagger (††) for 292 K. (c) Xe adsorption kinetics experiments. The blue curve shows the pressure drop in a chamber feeding Xe to an initially evacuated chamber with the SBMOF-1 sample; the red curve shows the corresponding weight increase due to Xe adsorption. (d) Xe adsorption/desorption cycling data; a sinusoidal curve is superimposed on the data. (a,c,d) Data for SBMOF-1 at 298 K.

