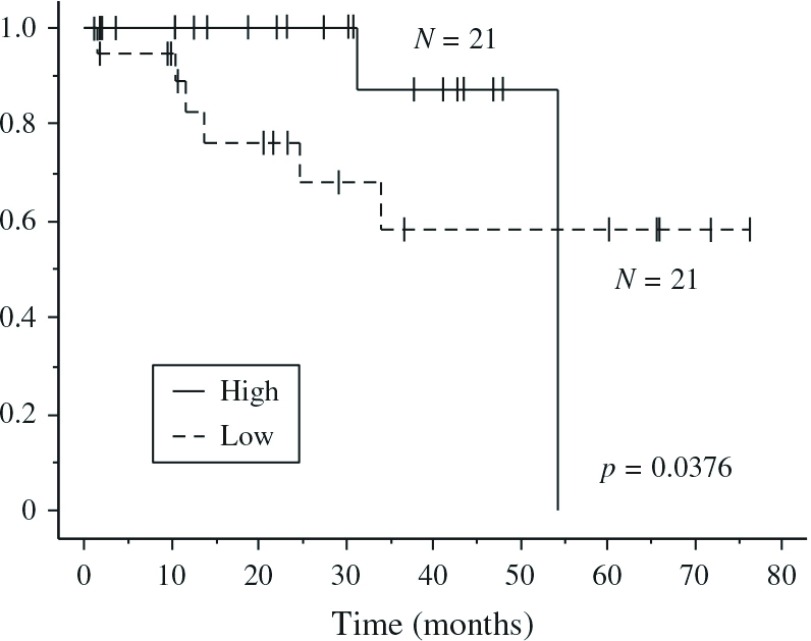
Fig. 3.
Postoperative overall survival (OS) curves according to the PA:A ratio for patients with NSCLC. Patients with higher (High) and the lower (Low) PA:A ratios are compared by the Wilcoxon test (p = 0.0376). PA:A: the pulmonary artery diameter to the ascending aorta diameter; NSCLC: non-small cell lung cancer

