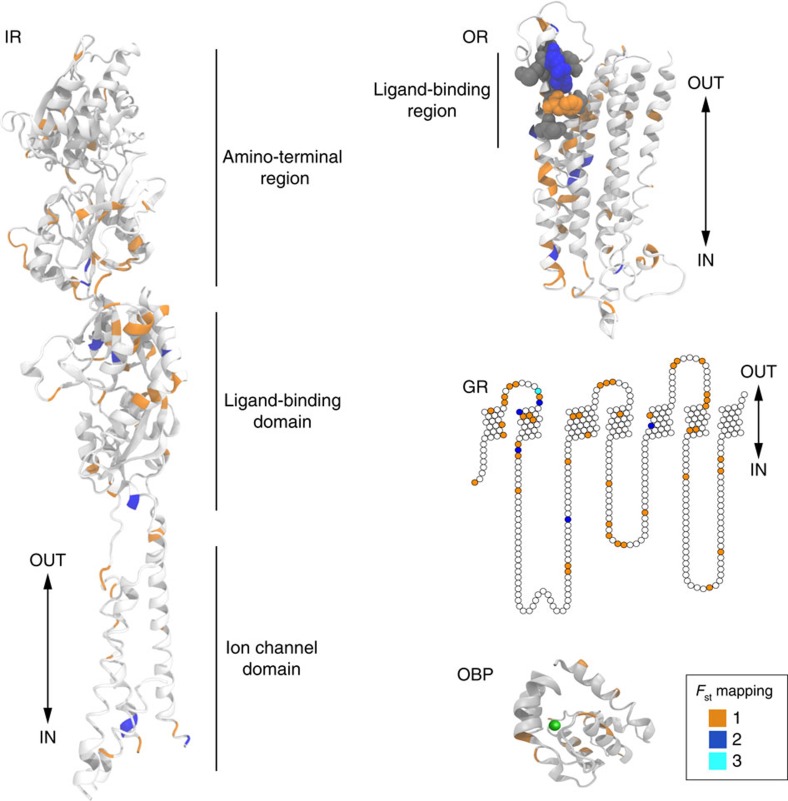
Figure 4. Candidate protein-altering SNPs on chemosensory protein models.
Protein model templates for the four chemosensory families onto which residues identified as selection candidates (top 1% Fst) are mapped. The colour coding (bottom right box) indicates the number of times a particular residue was identified as a candidate in pair-wise population comparisons. Although monomeric proteins are shown, IRs and ORs form heteromeric complexes of ligand-tuning receptors with structurally related co-receptors6, and GRs are also likely to function in multimeric assemblies16. Double-headed arrows next to these protein models indicate the approximate position of the sensory neuron membrane. IR: residues are mapped onto the X-ray crystal structure of the AMPA iGluR (PDB 3KG2). The IR amino-terminal region is much shorter and highly divergent from that of iGluRs, leading to very poor alignment quality, so the precise three-dimensional position of the mapped residues in this region is not informative. OR: residues are mapped onto the OR85b model built by amino-acid coevolutionary and secondary structure analyses41. The large dark-grey spheres on the OR structure highlight the location of residues experimentally implicated in influencing ligand recognition properties. We have excluded the high Fst residues for OR22b and OR22c due to the complex nature of the locus (polymorphic chimeric). GR: residues are mapped onto a snake plot of GR10b, as no three-dimensional information is available. OBP: residues are mapped onto the LUSH (OBP76a) structure (PDB: 2GTE). The green sphere indicates the internal cavity where the ligand is expected to reside.

