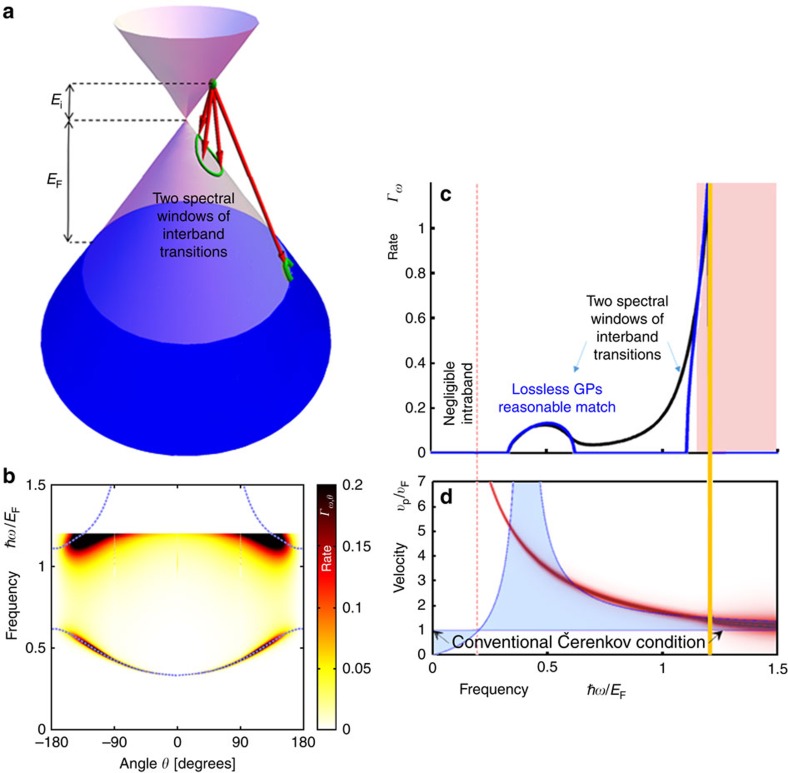
Figure 2. GP emission from hot carriers.
(a) Illustration of the possible transitions. The hot carrier (green dot) has a range of potential transitions (red arrows) with distinct final states (green curves and circles), emitting plasmons that satisfy conservation of momentum and energy (corresponding to the height and angle of the red arrows). This way the cone geometry correlates the GP frequency and angle. The projection of these arrows to a 2D plane predicts the in-plane angle θ of the plasmonic emission, matching the (b) map of GP emission rate as a function of frequency and angle, equation (6). We find most of the GP emission around the dashed blue curves that are exactly found by the Čerenkov angle equation (4). (c) Spectrum of the ČE GP emission process, with the red regime marking the area of high losses (as in ref. 19). Black, emission spectrum with GP losses, equation (6). Blue, lossless emission approximation, equation (5). The thick orange line marks the spectral cutoff due to the Fermi sea, beyond which all states are occupied (therefore, ℏω<Ei+EF). (d) Explaining the GP emission with the quantum ČE. The GP phase velocity is plotted as a red curve, with its thickness presenting the GP loss. The blue-shaded regime shows the range of allowed velocities according to the quantum ČE. We find enhanced GP emission in the frequencies for which the red curve crosses the blue regime, either directly or due to the curve thickness. The vertical dotted red line that crosses both c and d divides between interband to intraband transitions (exactly at ℏω=Ei). At the parameters presented in this figure, there is only negligible intraband transitions (zero spectrum on the left of the dotted line). All figures are presented in normalized units, except for the angle shown in degrees. The hot carrier energy Ei=0.2EF and ns=3 × 1013 cm−2 (corresponding to EF=0.639 eV).

