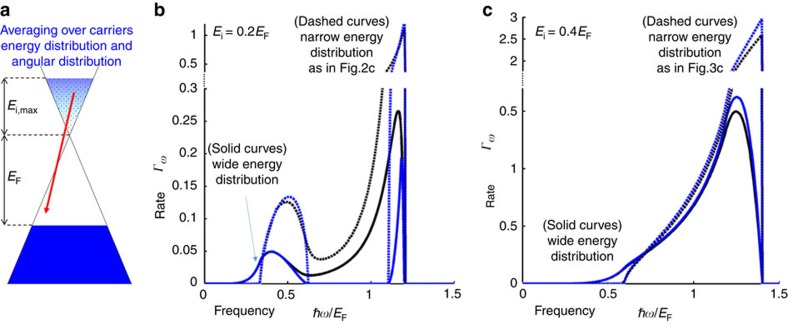
Figure 5. The spectrum of the Graphene ČE: hot carrier excitation energy having a wide versus narrow distribution.
(a) Illustration of the distribution of hot carriers, which is taken to be an exponential multiplied by the linear electron density of states in graphene. The exponential decay is (b)  with maximum hot carrier energy of Ei,max=0.2 eV corresponding to Fig. 2, or (c)
  with maximum hot carrier energy of Ei,max=0.4 eV corresponding to Fig. 3. In both b and c we plot the exact spectrum (integrating equation (6) over the energy distribution) in solid black and the lossless approximation (integrating equation (5) over the energy distribution) in solid blue. The dashed curves are for the respective cases of narrow energy distribution (matching Figs 2c and 3c). The Fermi energy EF is as in Figs 2, 3, 4.

