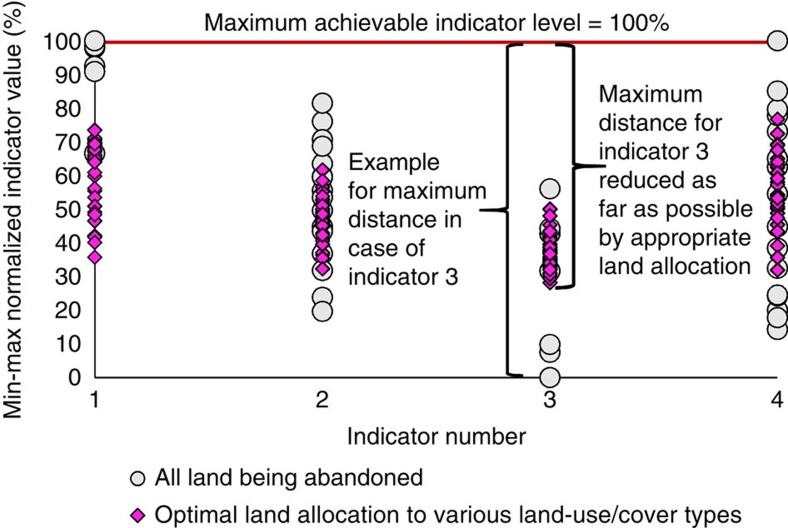
Figure 3. Schematic description illustrating improvement of achieved minimum levels of indicators.
The graph shows the min–max normalized (that is, indexed) achievement levels (y axis) for four potential indicators (x axis). The indexed indicators are scaled from zero (least desirable indicator value) to 100% (most desirable value). The four indicators given as examples represent the pH (indicator 1), soil organic carbon (indicator 2), base saturation (indicator 3) and carbon in microbial biomass (indicator 4). Each point represents the indicator achievement level for the considered uncertainty scenarios (25=32) for each indicator. Results for two land-use allocation scenarios are depicted: grey circles represent the indicator values under the scenario that all of the land is allocated to abandoned land. For indicator number 3, abandoned land would give the least desirable indicator value of zero for some of the uncertainty scenarios. Hence, the maximum distance to the most desirable value is 100%. Pink diamonds represent the indicator achievement levels under the ‘optimized' scenario, consisting of a mixture of various land-cover types, which buffers against uncertainty. In this scenario, land is allocated to the five land-cover types (four rehabilitation options plus the ‘abandoned' category) in a way that minimizes the maximum distance to the 100% achievement level. Here landscape-level indicators consist of the sum of the indicators recorded for the individual land-cover types (reported in Table 1), which have been multiplied with the area fraction allocated to the corresponding land-cover type.

