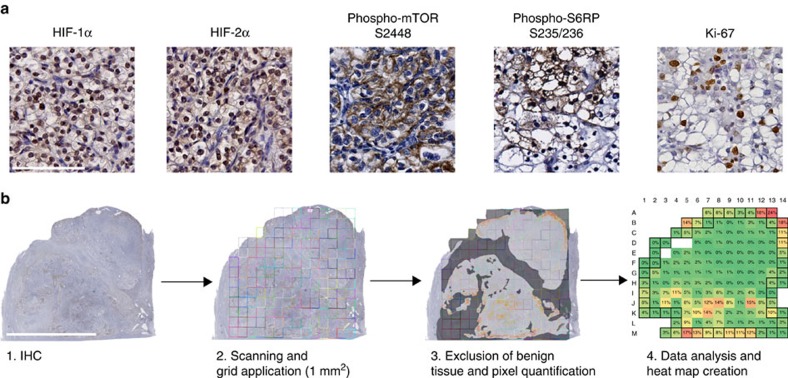
Figure 1. Precision quantitative image analysis workflow for the characterization of functional ITH.
(a) Representative areas with positive immunohistochemical (IHC) staining for HIF-1α, HIF-2α, phospho-mTOR S2448, phospho-S6RP S235/236 and Ki-67. Only nuclear HIF-1α and HIF-2α expression was included in the analysis. Scale bar, 100 μm. (b) Overview of the quantitative IHC analysis process using a representative image of a whole-slide scanned pT1M1 tumour after phospho-mTOR S2448 staining. The image was overlaid with a virtual grid consisting of 1 mm2 squares that defines the tumour regions to be analysed. Non-cancerous tissue was subtracted manually (dark grey) and a positive pixel count was performed on the corrected area. Positivity per square was expressed as percentage of positive pixels. If a square contained non-tumorous tissue, the positivity was normalized to the corrected square area. Computed values were depicted as a heat map. Coloured squares represent tumour, whereas open squares indicate completely non-tumorous areas. Squares defined as peripheral tumour zone are marked by a black line. Scale bar, 1 cm.

