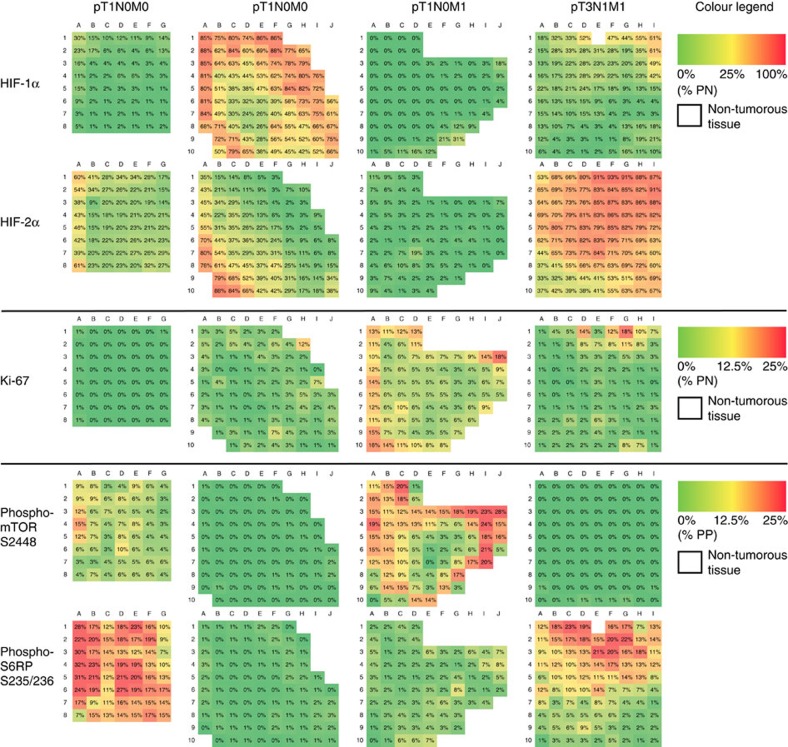
Figure 2. Functional ITH is independent from tumour stage.
Representative heat maps of biomarker expression (HIF-1α, HIF-2α, phospho-mTOR S2448, phospho-S6RP S235/236 and Ki-67) in different prognostic subgroups. Positivity per square was calculated using the positive nuclear count for HIF-1α, HIF-2α and Ki-67, and expressed as percentage positive nuclei (% PN). Colours correspond to % PN and range from absent (0% PN; green) to high (100% PN; red) for HIF-1α and HIF-2α. Ki-67 showed a maximum of 25% PN and thus is represented by a smaller range from 0% PN (green) to 25% PN (red). Cytoplasmic staining for phospho-mTOR S2448 and phospho-S6RP S235/236 was analysed as shown in Fig. 1 and expressed as percentage positive pixels (% PP). Note that a square with 25% PP is considered completely positive. White squares represent completely non-cancerous tissue and were excluded from analysis.

