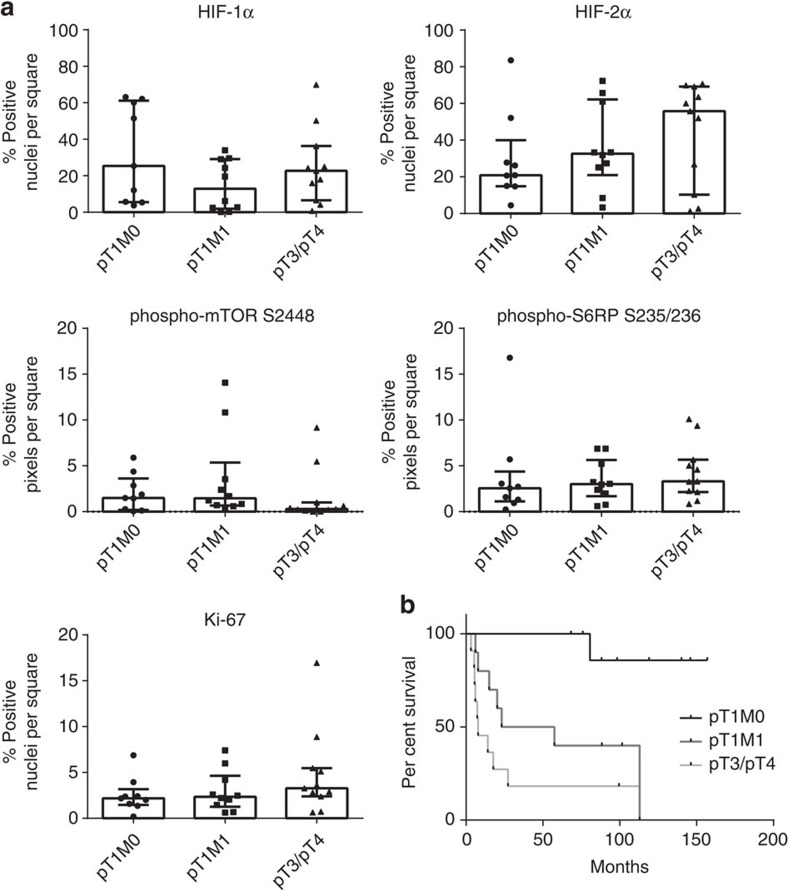
Figure 3. Quantification of functional ITH in prognostic ccRCC subgroups.
(a) Scatter plots showing median±interquartile range of the mean percentage positive pixels (phospho-mTOR S2448 and phospho-S6RP S235/236) or mean percentage positive nuclei (HIF-1α, HIF-2α and Ki-67) per tumour. No statistically significant differences were observed between subgroups (P>0.05, Kruskal–Wallis test for multiple comparisons). (b) Kaplan–Meier cancer-specific survival analysis of the patients.

