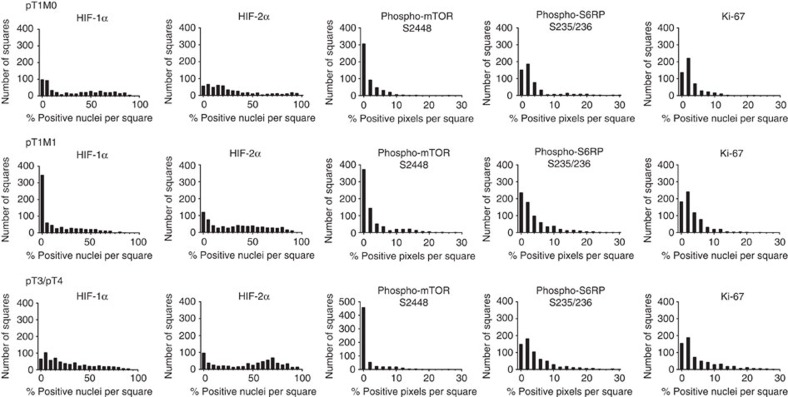
Figure 4. Heterogeneous expression of markers of functional ITH in prognostic ccRCC subgroups.
Cumulative histograms of tumour subgroups representing the number of squares that contained a certain percentage of positive pixels or positive nuclei are shown. None of the marker distribution passed the D'Agostino–Pearson omnibus normality test indicating a non-Gaussian distribution and therefore a heterogeneous expression pattern in all three prognostic subgroups.

