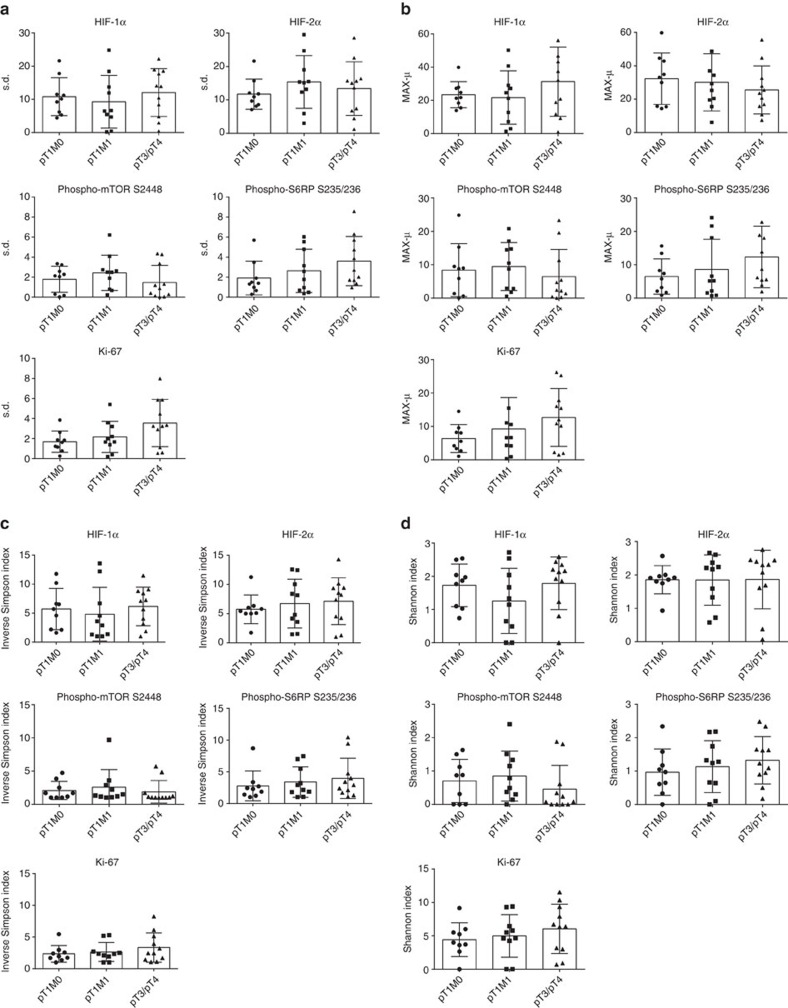
Figure 5. Functional ITH is stage independend as measured by heterogeneity scores and biodiversity indices.
(a–d) Scatter plots representing mean±s.d. and individual values of the heterogeneity scores s.d. (a), MAX-μ (b), inverse Simpson index (c) and Shannon index (d) for the indicated biomarkers and prognostic subgroups.

