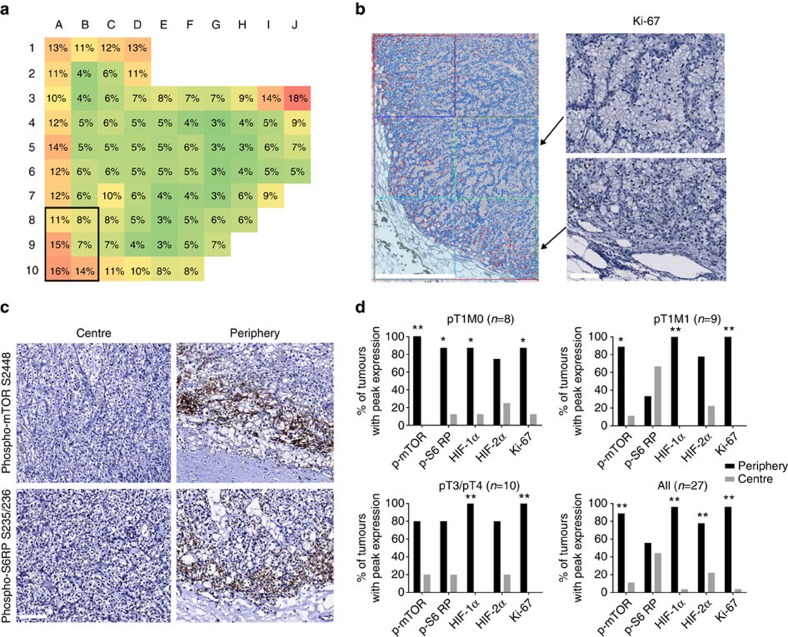
Figure 6. Topological differences in functional ITH define tumour centre and periphery as distinct spatial niches.
(a,b) Heat map and immunohistochemical staining of a representative ccRCC for Ki-67. A representative picture showing the PNC analysis is shown in (b, left panel). Positive nuclei are false coloured in red, negative nuclei blue. Scale bar, 1 mm. High-power views of squares B9 and B10 immunostained for Ki-67 are shown (b, right panels). Note the differences in proliferating cells between squares B9 (centre) and B10 (periphery). Scale bar, 100 μm. (c) Representative immunohistochemical stainings for phospho-mTOR S2448 and phospho-S6RP S235/236 in the tumour centre and the tumour periphery. Scale bar, 100 μm. (d) Each bar shows the percentage of tumours with peak marker expression in the central (grey bars) versus peripheral (black bars) tumour zone. Significance was assessed using the Bernoulli trial (*P<0.05, **P<0.01).

