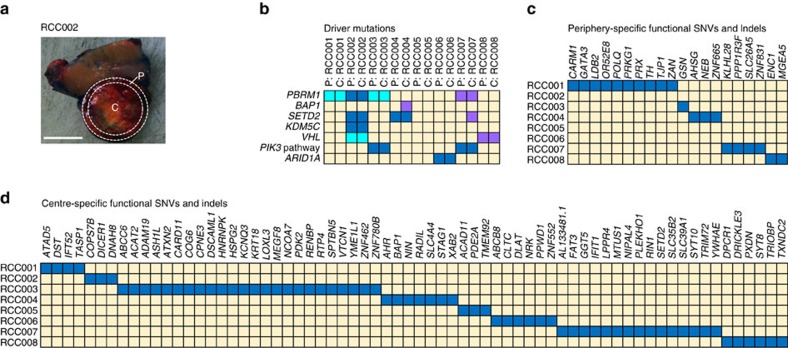
Figure 7. Whole-exome sequencing reveals distinct mutations in the tumour centre and periphery.
(a) Macroscopic view of RCC002 with centre (C) and periphery (P) labelled as dissected. Scale bar, 1 cm. (b) Map of driver mutations found in the tumour periphery or tumour centre of all samples. Colour indicates the presence of a mutation (blue, nonsynonymous SNV; lavender, frameshift; cyan, stop gain/loss). Yellow indicates the absence of a mutation. (c,d) Maps of functional SNVs and indels (blue) specific for the tumour periphery (c) or centre (d).

