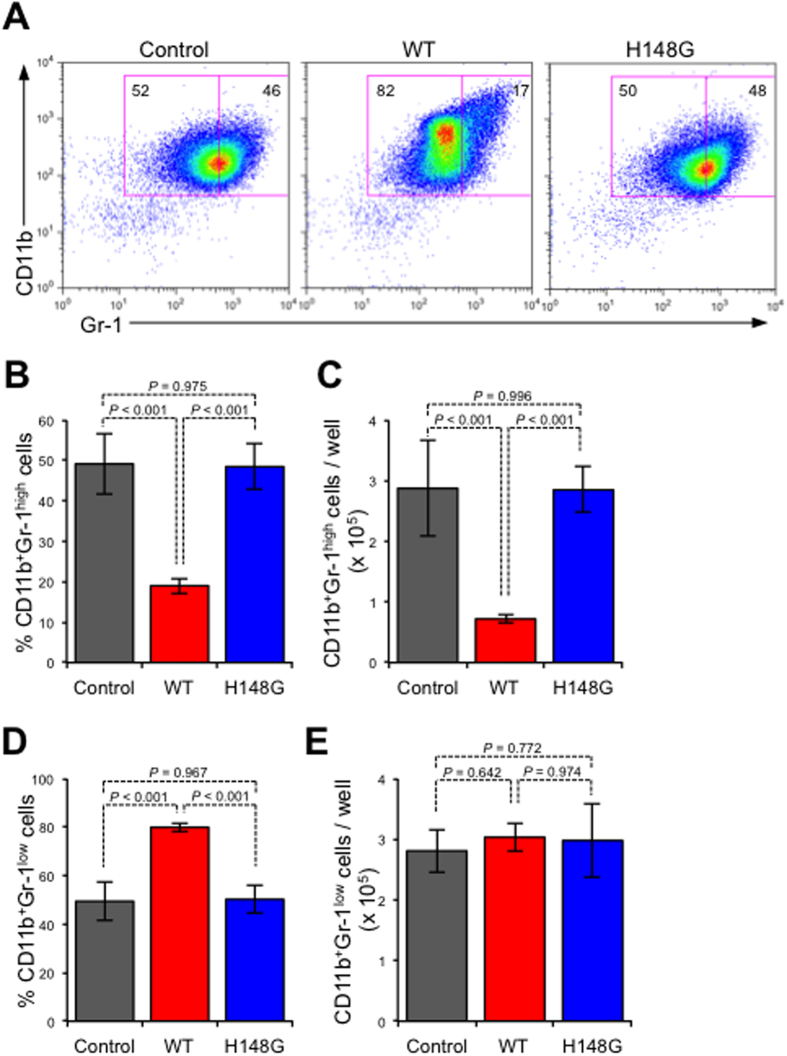
Figure 5. α-Toxin directly affects neutrophils.
A total of 1 × 10⁶ magnetically isolated Gr-1+ cells (n = 6 per condition) were cultured for 24 hours in the presence or absence (Control) of 100 ng/ml α-toxin (WT) or a variant α-toxin (H148G). Representative flow cytometry profile (A), the frequency and absolute number of CD11b+Gr-1high neutrophils per culture well (B,C), and the frequency and absolute number of CD11b+Gr-1low neutrophils per culture well (D,E) are shown. Values are mean ± standard deviation. One-way analysis of variance was employed to assess statistical significance.

