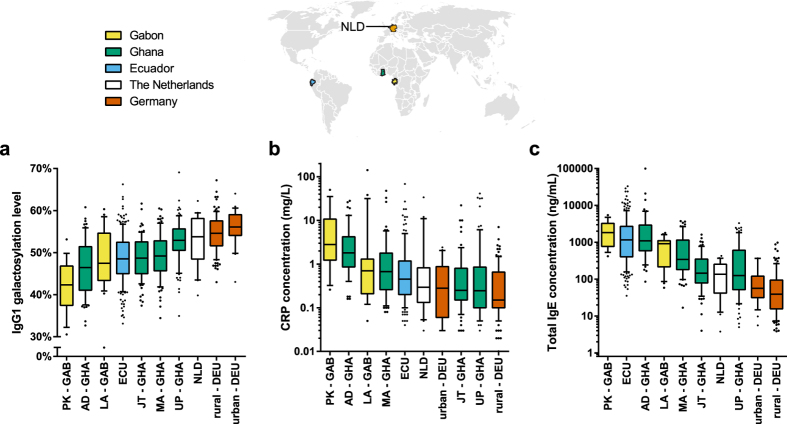
Figure 2.
(a) IgG1 galactosylation, (b) CRP levels and (c) total IgE levels compared between various communities and countries. Boxplots have 10–90% whiskers. The world map was based on a figure from Wikimedia Commons and modified using Adobe Illustrator CC 2014 (Adobe Systems Inc., San Jose, CA, USA).

