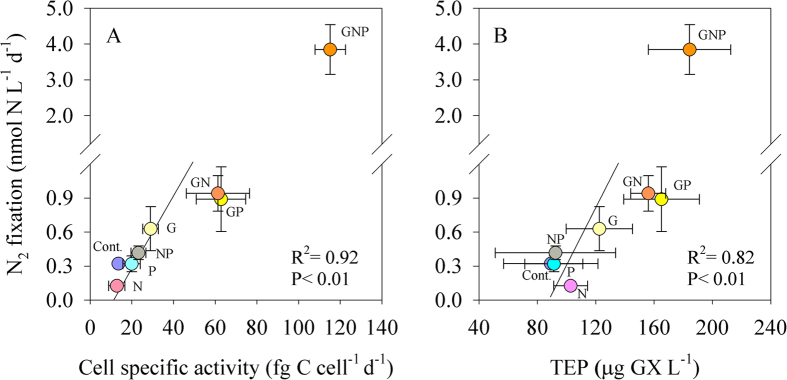
Figure 4.
The relationship between N2 fixation and heterotrophic cell-specific activity (A) and TEP (B). Microcosms were conducted under dark + DCMU incubations for 48 h. Each nutrient addition type has a different color-code. Note that the GNP treatments were not included in the linear correlation. A Pearson linear correlation was carried out between N2 fixation and bacterial cell specific activity and TEP (P < 0.05).

