Figure 2.
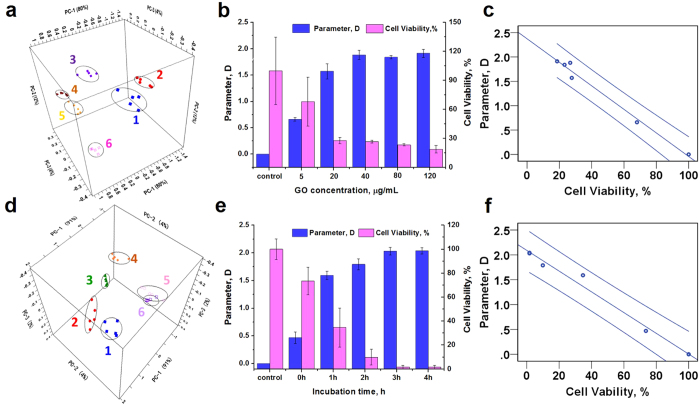
(a) The PCA results of E. coli DH5α incubated under different GO concentrations. 1 represents the control group and 2–6 principal components are from the samples incubated with different GO concentrations at 5, 20, 40, 80 and 120 μg/mL for 2 h. (d) The PCA results of time experiment. 1 represents the control group. 2–6 represent principal components obtained from the data incubated with GO (80 μg/mL) at different time: 0, 1, 2, 3 and 4 h. (b,e) show the relationship between GO concentration or incubation time and the parameter D as well as the cell viability rate of E. coli DH5α. (c,f) present the bivariate analysis results, and a significant negative correlation between the parameter D and cell viability rate were obtained in concentration experiment (Person’s correlation coefficient: −0.99, p < 0.01 in c) and time experiment (Person’s correlation coefficient: −0.99, p < 0.01 in f).

