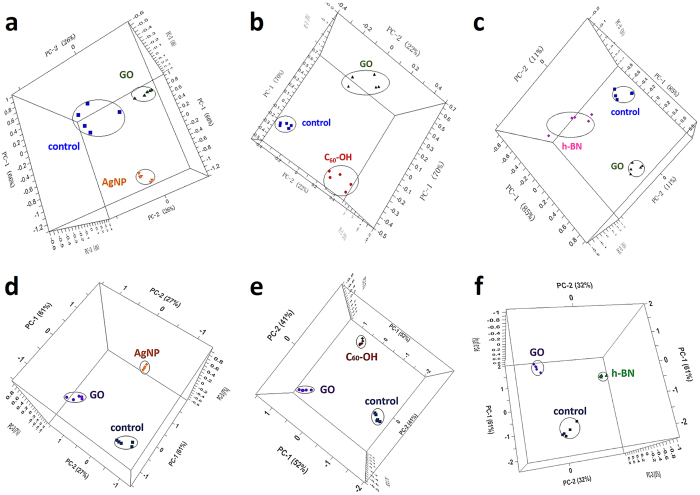
Figure 4.
(a) The three principal components in PCA scores plot represent the E coli. DH5α control group (◾), GO group (▴) and AgNPs (▾) group (5 μg/mL, 2 h). (b) The three principal components in PCA scores plot represent the E coli. DH5α control group (◾), GO group (▴) and hydroxylated fullerene group (⦁) (80 μg/mL 2 h). (c) The three principal components in PCA scores plot represent the control group (▾), and the GO groups (▴) and hexagonal boron nitride (♦) group (80 μg/mL, 2 h). (d–f) The three principal components in PCA scores plot of ATCC 25922 represent the control group (◾), the GO group (▴) and AgNPs (▾) group (5 μg/mL, 2 h), hydroxylated fullerene group (⦁) (80 μg/mL 2 h) and hexagonal boron nitride (♦) incubation (80 μg/mL, 2 h), respectively.

