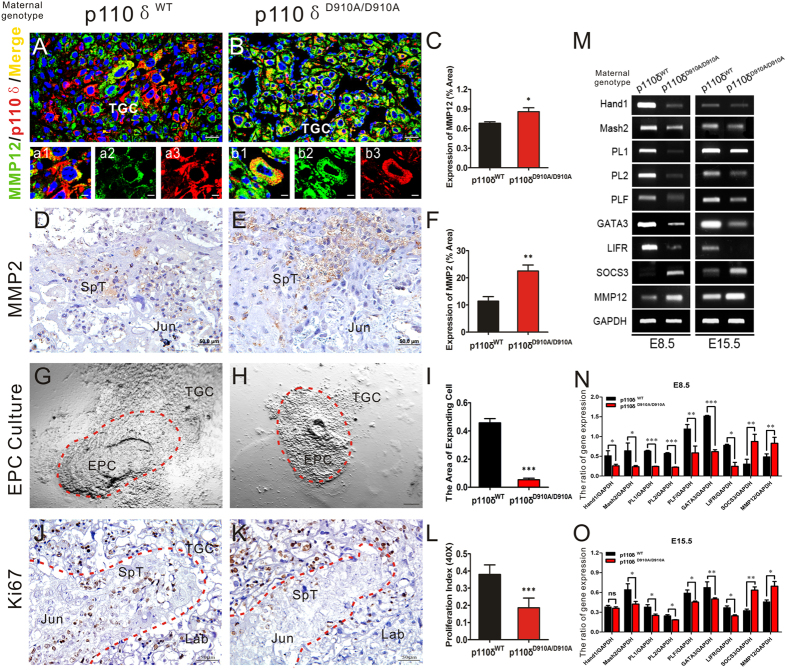
Figure 5. The capabilities of TGCs were restricted in inactive p110δ derived placentas.
TGCs function was restricted in inactive p110δ. (A,B) Dual immunofluorescent test against p110δ and MMP12 on transverse sections of E8.5 tissue from p110δWT (n = 6) and p110δD910A/D910A (n = 6) female mice. (C) The statistical result of MMP12 expression in TGCs. (D,E) Immunohistochemistry test against MMP2 on transverse sections of E15.5 placenta from p110δWT (n = 6) and p110δD910A/D910A (n = 7) female mice. (F) The statistical result of MMP2 expression. (G,H) Bright-field images showed cultured EPC tissues from p110δWT (n = 3 mice) and p110δD910A/D910A (n = 4 mice) female mice, respectively. The TGCs that migrated out of original EPCs were indicated by red dotted lines in (G,H). (I) The statistical result of TGCs extension areas from the in vitro cultured EPC tissues. (J,K) The immunohistochemistry test against Ki67 on transverse sections of E15.5 placenta from p110δWT (n = 12) and p110δD910A/D910A (n = 11) female mice. The junctional zone, which was rich in SpT, was indicated with red dotted lines. (L) The statistical result of proliferation index. (M) RT-PCR results showed the mRNA expression of Hand1, Mash2, PL1, PL2, PLF, GATA3, LIFR, SOCS3 and MMP12 in deciduas at E8.5 and the placenta at E15.5 from p110δWT and p110δD910A/D910A female mice, respectively. (N,O) The quantitative analysis of genes mRNA expression. EPC, ectoplacental cone. The statistical data are expressed as the mean ± S.D. *P < 0.05, **P < 0.01, ***P < 0.001 and ns: P > 0.05. Scale bars: 25 μm (A,B), 50 μm (D,E,J,K), 200 μm (G,H).

