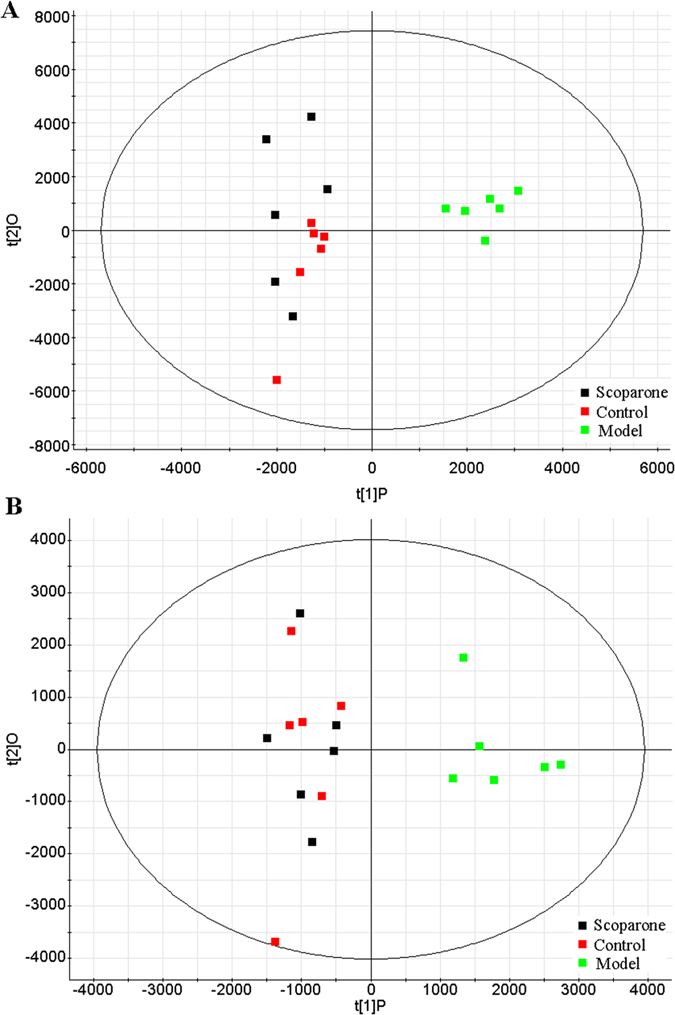
Figure 5. Lipid metabolic profiling changes caused by scoparone.

(A) PCA score plot of cellular lipidome for classifying the control, model and scoparone group in positive ion mode; (B) PCA score plot of cellular lipidome for the clustering of control, model and scoparone group in negative ion mode.
