
Fig. 5.
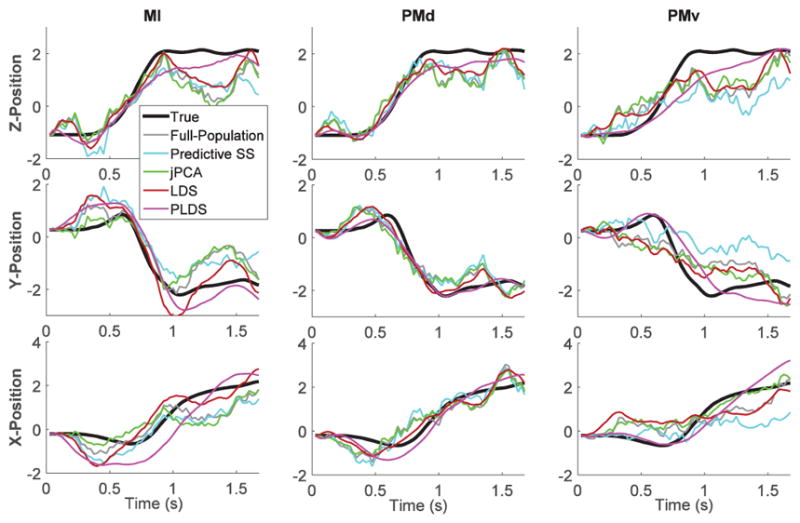
Example of 3-D position decoding. Decoding of the reach trial shown in Fig. 4(a) based on recorded spike trains (full-population, random subsampling, predictive subsampling) and inferred low-dimensional dynamics (LDS, PLDS, jPCA) from areas M1, PMd and PMv. Decoded position trajectories based on different approaches are compared to true trajectories (black curves). Position trajectories have been normalized (z-score).