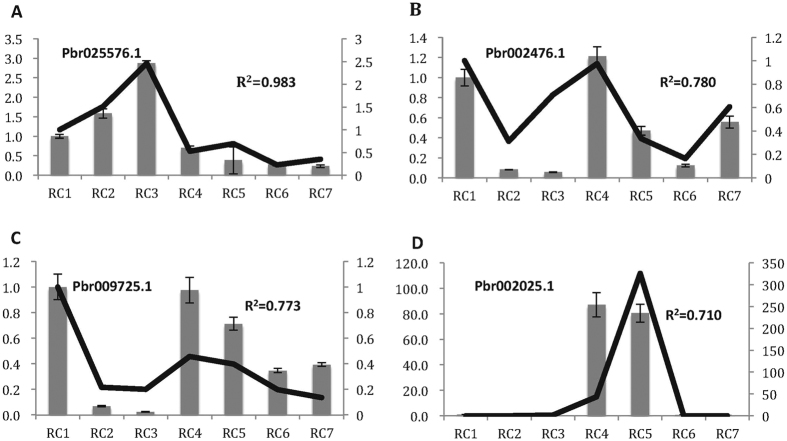
Figure 8. Comparison of RNA-seq based gene expression and q-PCR verification.
Figures represent expression of four genes for seven fruit developmental stages of ‘Red Clapp’s Favorite’. X-axis represents the fruit developmental stages. Y-axis on the left shows the relative gene expression levels of q-PCR by bar charts, and the Y-axis on right illustrated the relative values of RPKM with line charts. The RPKM of Y-axis on the right were unified by dividing the first stage’s gene expression value in (A–C).

