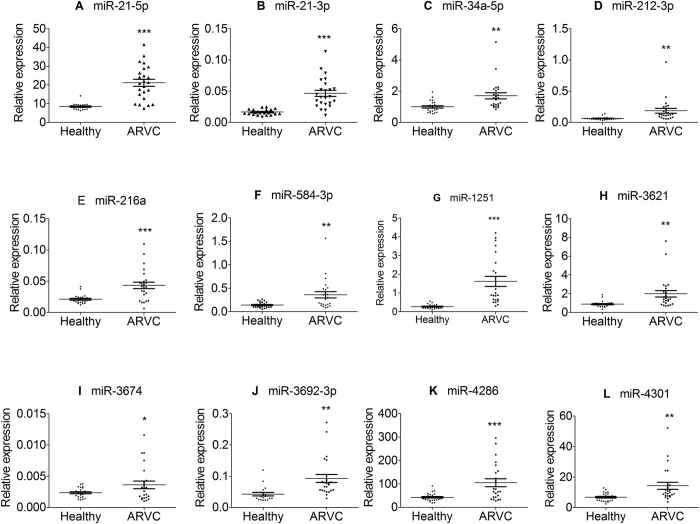
Figure 3. Differentially expressed 12 up-regulated microRNAs in the ARVC patients and healthy controls.
Relative expression of microRNAs was determined by S-Poly (T) Plus method in the tissue of 24 ARVC patients and 24 healthy controls. The miRNA levels were normalized to SNORD44 and represented in scatter plots. Data were shown as means ± SE, *p < 0.1 vs. healthy controls, **p < 0.01 vs. healthy controls, ***p < 0.001 vs. healthy controls.

