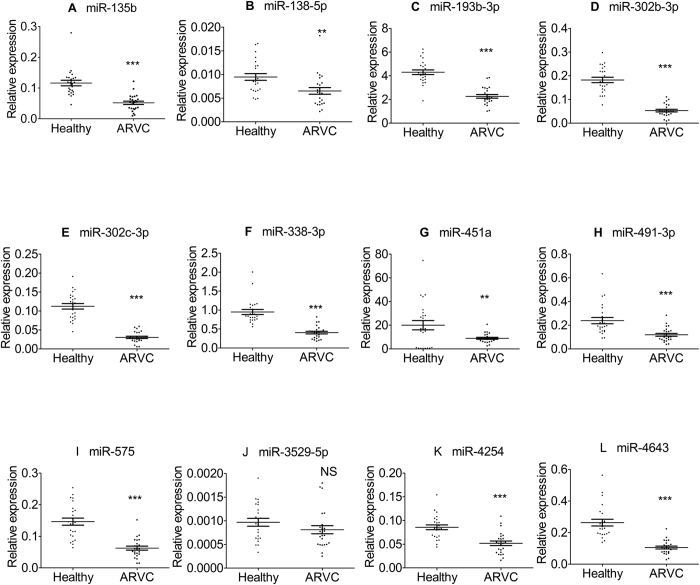
Figure 4. 12 miRNAs were confirmed to be significantly down-regulated in ARVC patients compared with control group.
The miRNA levels were normalized to SNORD44 and represented in scatter plots. Data were shown as means ± SE, *p < 0.1 vs. normal controls, **p < 0.01 vs. normal controls,***p < 0.001 vs. normal controls.

