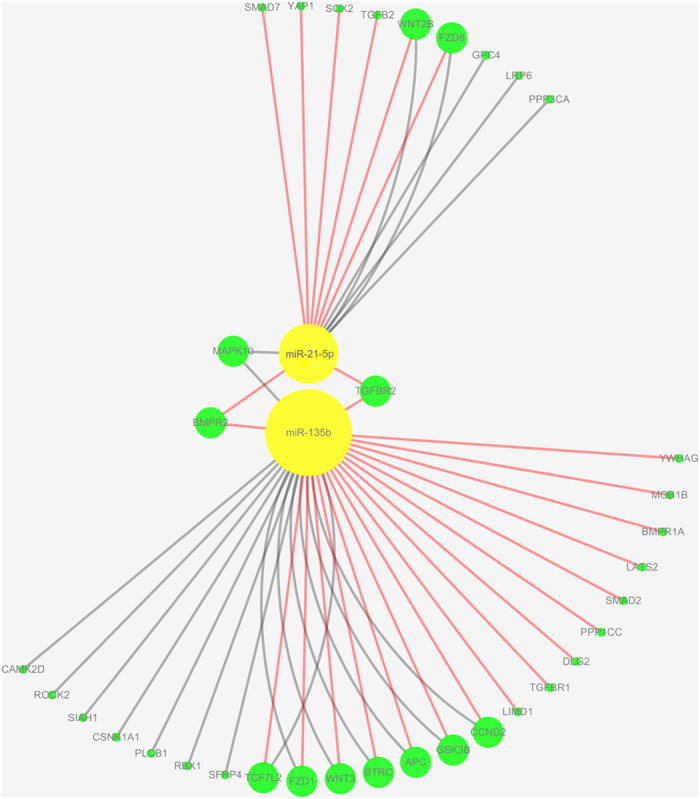
Figure 8. KEGG analysis was carried out with online software KOBAS 2.0 (http://kobas.cbi.pku.edu.cn/home.do).

The miRNA-gene network indicated the relationship between miR-21-5p/miR-135b and Wnt/Hippo pathway was built using the software Cytoscape. Green circular nodes represent genes, and yellow circular nodes represent miR-21-5p or miR-135b. Red edges denoted the Hippo pathway, and grey edges indicated Wnt pathway.
