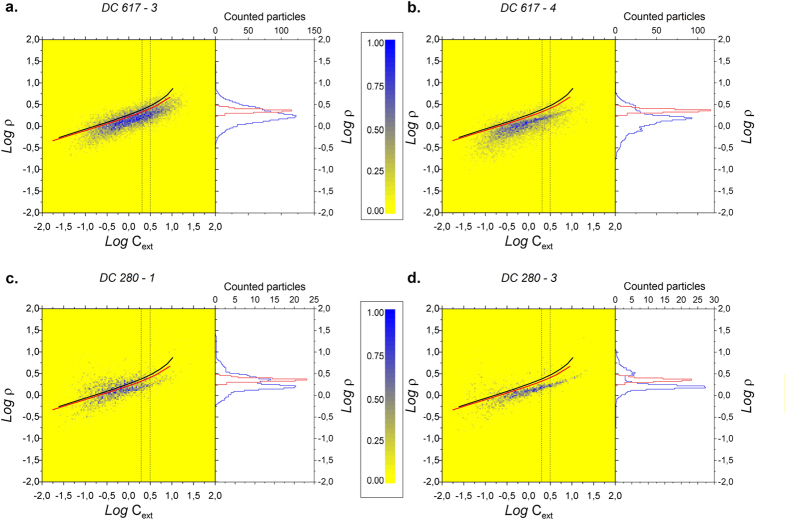
Figure 1. SPES optical data from the old Dome C ice core represented as the adimensional optical thickness (ρ) versus extinction coefficient (Cext) (μm2).
Data are 2D histograms, the color scale indicating the number of particles (yellow = 0, blue = 1, linear scale) in each 2D bin, normalized to the maximum value of each plot. In a and b two adjacent glacial samples (LGM, ca. 22300 yrs B.P.) are considered (DC-617-3 and DC-617-4 respectively); in c and d we show two Holocene samples (ca. 7430–7440 yrs B.P.; DC-280-1 and DC-280-3). Time interval is <15 years for a and b, <10 years for c and d. Continuous lines represent the expected SPES results for spheres with refractive index n = 1.55 (black) and n = 1.50 (red), very close to the indices of the minerals found in the Dome C ice core (Gaudichet et al.39). Each plot shows the optical thickness distribution evaluated in the Cext range within the vertical lines which is 2 μm2 < Cext < 3.1 μm2 (blue SPES data, red simulated spheres).

