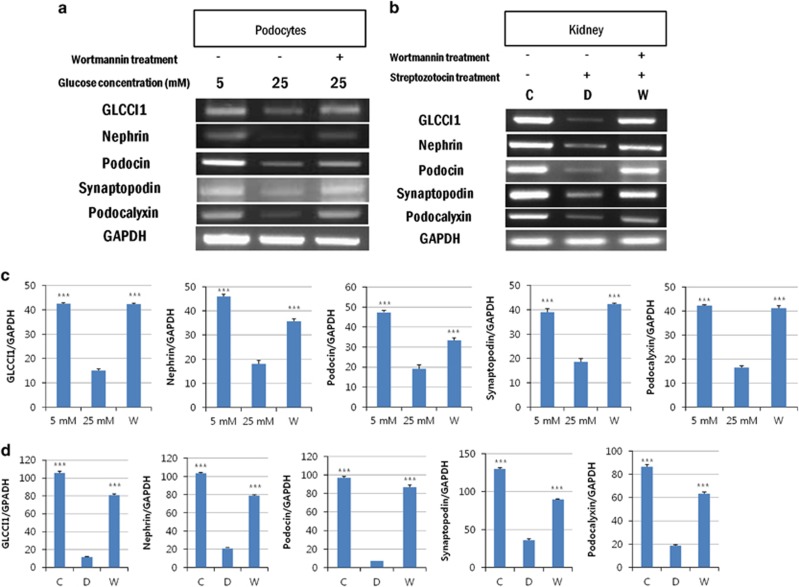
Figure 1.
Detection of glucocorticoid-induced transcript 1 (GLCCI1) and podocyte-specific marker gene expression by reverse transcription-PCR (RT-PCR). (a) Expression of the genes encoding GLCCI1, nephrin, podocin, synaptopodin and podocalyxin showed similar patterns in the podocytes. The expression levels differed significantly between the high glucose-induced and wortmannin-treated diabetic groups of podocytes. (b) The expression of the genes encoding GLCCI1, nephrin, podocin, synaptopodin and podocalyxin showed similar patterns in the kidneys of diabetic rats. In addition, wortmannin ameliorated the expression of all podocyte-specific proteins including GLCCI1. (c, d) The relative band intensity of proteins in podocytes and the kidneys of diabetic rats was observed by RT-PCR. The band intensity was measured using the Multi Gauge V3.0 software (Fuji Film). ***P<0.001, 5 mM (control) and wortmannin-treated diabetic groups versus the high glucose–induced group by analysis of variance (ANOVA; means±s.e.m., n=3).

