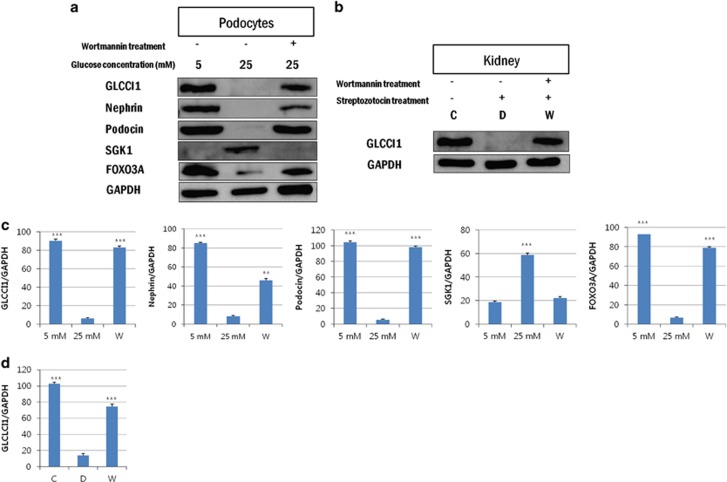
Figure 2.
Analysis of glucocorticoid-induced transcript 1 (GLCCI1) protein expression and involvement in the phosphoinositide 3-kinase (PI3K) pathway by western blotting. (a) GLCCI1, nephrin and podocin were expressed only in the 5 mM and the wortmannin-treated diabetic groups. Serum/glucocorticoid-regulated kinase 1 (SGK1) was expressed only in the high glucose-induced group. Forkhead box O3 (FOXO3A) was regulated by wortmannin. (b) GLCCI1 was expressed only in the control and wortmannin-treated diabetic groups. GLCCI1 was significantly decreased in the diabetic group. (c, d) The relative band intensities of proteins in the podocytes and the kidneys of diabetic rats were observed by western blot analysis. The band intensities were measured using the Multi Gauge V3.0 software (Fuji Film). ***P<0.001, 5 mM (control) and wortmannin-treated diabetic groups versus the 25 mM (diabetes) group by analysis of variance (ANOVA; means±s.e.m., n=3).

