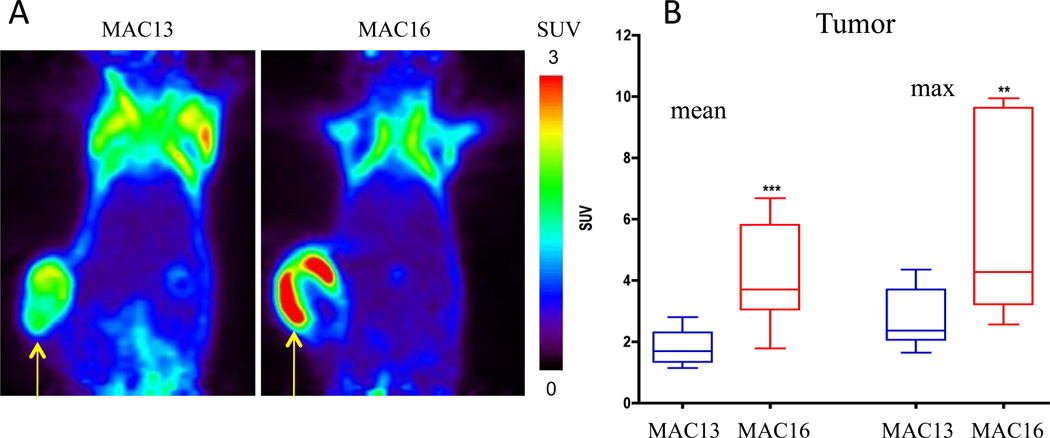
Figure 3.
(A) Representative PET images of 18FDG uptake in MAC13 and MAC16 tumor bearing mice (SUV: standardized uptake value). (B) Quantification of the uptake in the tumors. Values represent Mean ± SEM (MAC13, n = 8, MAC16, n = 5; * P < 0.005). Adapted with permission from [34].

