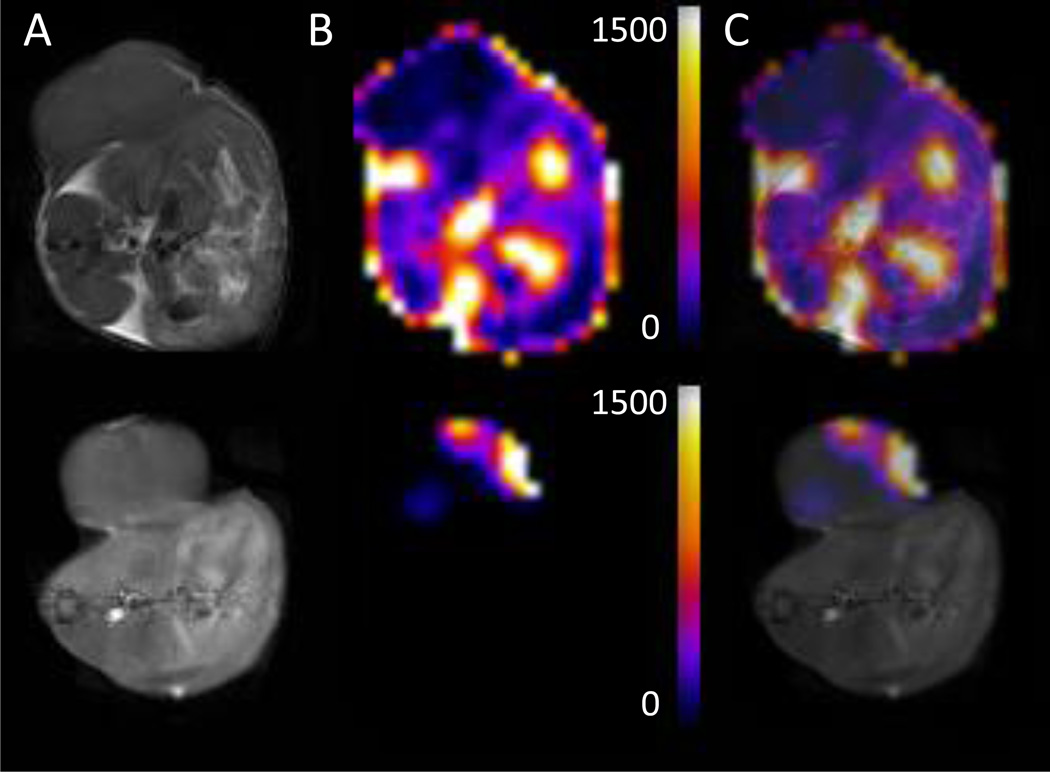
Figure 4.
(A) Cross-sectional T1-weighted images, (B) cross-sectional lactate+lipids maps, and (C) merged images from (A) and (B) of MAC13 (upper panel) and MAC16 (lower panel) tumor-bearing mice. T1-weighted images were acquired from the corresponding 4 mm slice used for MRSI using a spin-echo sequence with an echo time of 10 ms, a repetition time of 500 ms, and an in-plane spatial resolution of 125 µm. Lipid maps were generated from MRSI data and normalized to the water signal. Volumes were comparable for the MAC13 (540 mm3) and MAC16 (545 mm3) tumors. Adapted with permission from [34].

