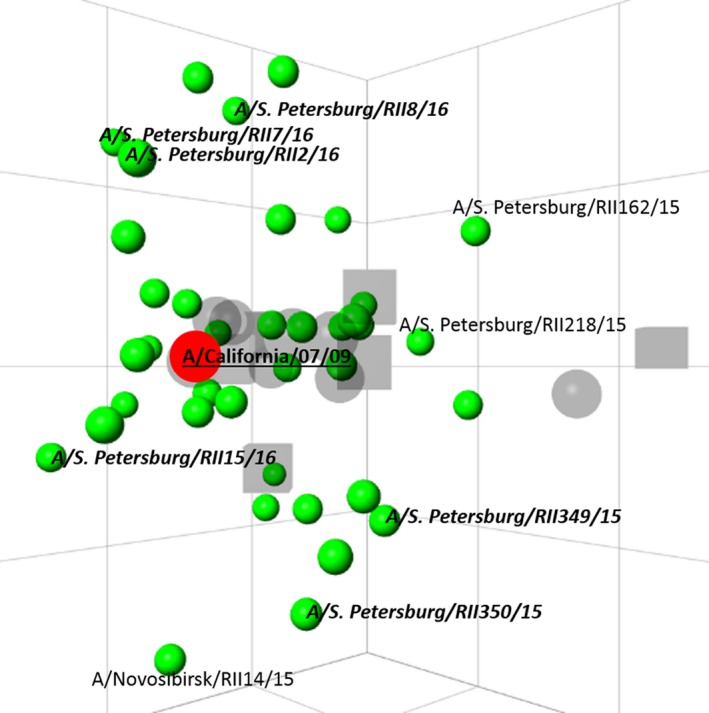
Figure 2.

Antigenic map of influenza A(H1N1)pdm09 viruses isolated in Russia in 2009‐2016. The square on the map corresponds to a twofold difference in the homologous HI titer between the vaccine strain and the tested strain. Dots are viruses, squares—antisera. The vaccine strain is shown in red, with bold and underlined text. Strains isolated in epidemic season 2015/2016 are indicated in italicized bold.
