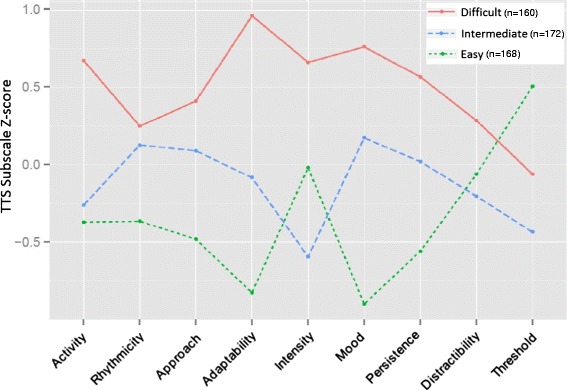
Fig. 1.

Distribution of TTS Subscale Performance Z-scores by Latent Profiles. Although each profile demonstrates a mix of “easy”, “intermediate”, and “difficult” temperamental traits on varying subscales, profile 1 children generally demonstrated a more difficult temperament, profile 2 generally demonstrated more intermediate temperamental traits, and profile 3 children generally demonstrated an easy temperament
