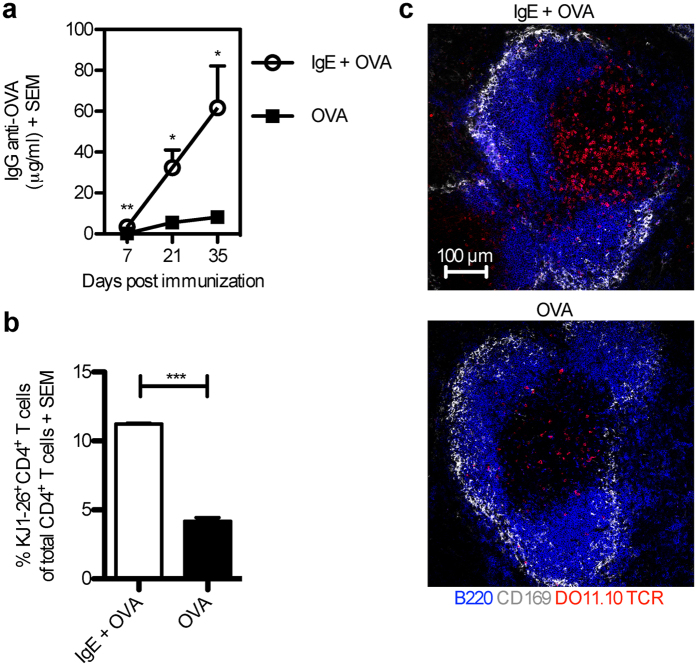
Figure 1. IgE anti-OVA enhances both OVA-specific IgG and CD4+ T cell responses.
(a) BALB/c mice were immunized with 50 μg IgE anti-OVA pre-mixed with 20 μg OVA (n = 7), or 20 μg OVA alone (n = 7). Sera from d 7, 21, and 35 after immunization were analysed for IgG anti-OVA by ELISA. (b) BALB/c mice were adoptively transferred with splenocytes from DO11.10 mice one day before administration of 50 μg IgE anti-OVA pre-mixed with 20 μg OVA (n = 3) or 20 μg OVA alone (n = 3). Spleens were harvested 3 days after immunization and half of each spleen was analysed for proliferation of OVA-specific CD4+ T cells by flow cytometry. The gating strategy is shown in Supplementary Fig. S2. Percentages of KJ1-26+CD4+ T cells among total CD4+ T cells of each group were then quantified. (c) The other half of each spleen as in (b) was frozen and spleen sections were stained and analysed by confocal microscopy. B220, blue; CD169, grey; DO11.10 TCR, red. Images show T cell areas (640 μm × 640 μm) representative of 6 T cell zones from 2 non-consecutive sections per sample in each group. Scale bar represents 100 μm. (a,b) Data are representative of three independent experiments and are shown as mean + SEM. Significance was determined between the group immunized with IgE-OVA complexes and the group immunized with OVA alone by Student’s t-test. *p < 0.05; **p < 0.01; ***p < 0.001.

