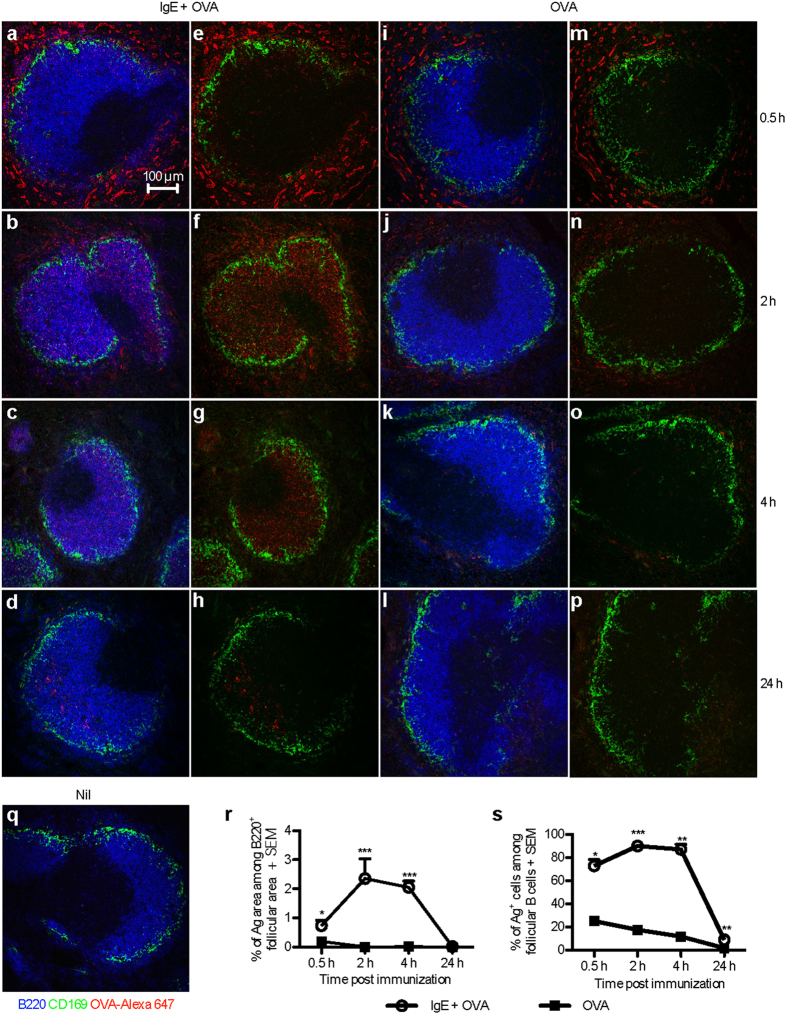
Figure 2. OVA administered together with specific IgE is rapidly transported to splenic B cell follicles.
BALB/c mice were immunized with 50 μg IgE anti-OVA pre-mixed with 150 μg OVA-Alexa 647 (n = 2 per time point) (a–h), 150 μg OVA-Alexa 647 alone (n = 2 per time point) (i–p), or left unimmunized (q). Spleens were harvested 0.5, 2, 4, or 24 h after immunization. Non-consecutive sections of spleens were stained and analysed by confocal microscopy. B220+ B cells, blue; CD169+ metallophilic macrophages, green; OVA-Alexa 647, red. (a–d,i–l,q) All colors are shown. (e–h,m–p) All colors expect blue are shown. (a–q) Images show follicular areas (640 μm × 640 μm) representative of 3–4 follicular areas from 2 non-consecutive sections per sample in each group. Scale bar represents 100 μm. Data represent one experiment at 0.5 h and 2 h and two experiments at 4 h and 24 h. (r) Quantification of the Ag+ area within the B220+ follicular area. (s) Percentages of Ag+ cells among follicular B cells was analysed by flow cytometry on splenocytes from the other half of each spleen in (a–p). Follicular B cells are gated as B220+CD21+CD23high cells (Supplementary Fig. S3). (r,s) Data are shown as mean + SEM. Significance was determined between the group immunized with IgE-OVA complexes and the group immunized with OVA alone by Student’s t-test. *p < 0.05; ***p < 0.001.

