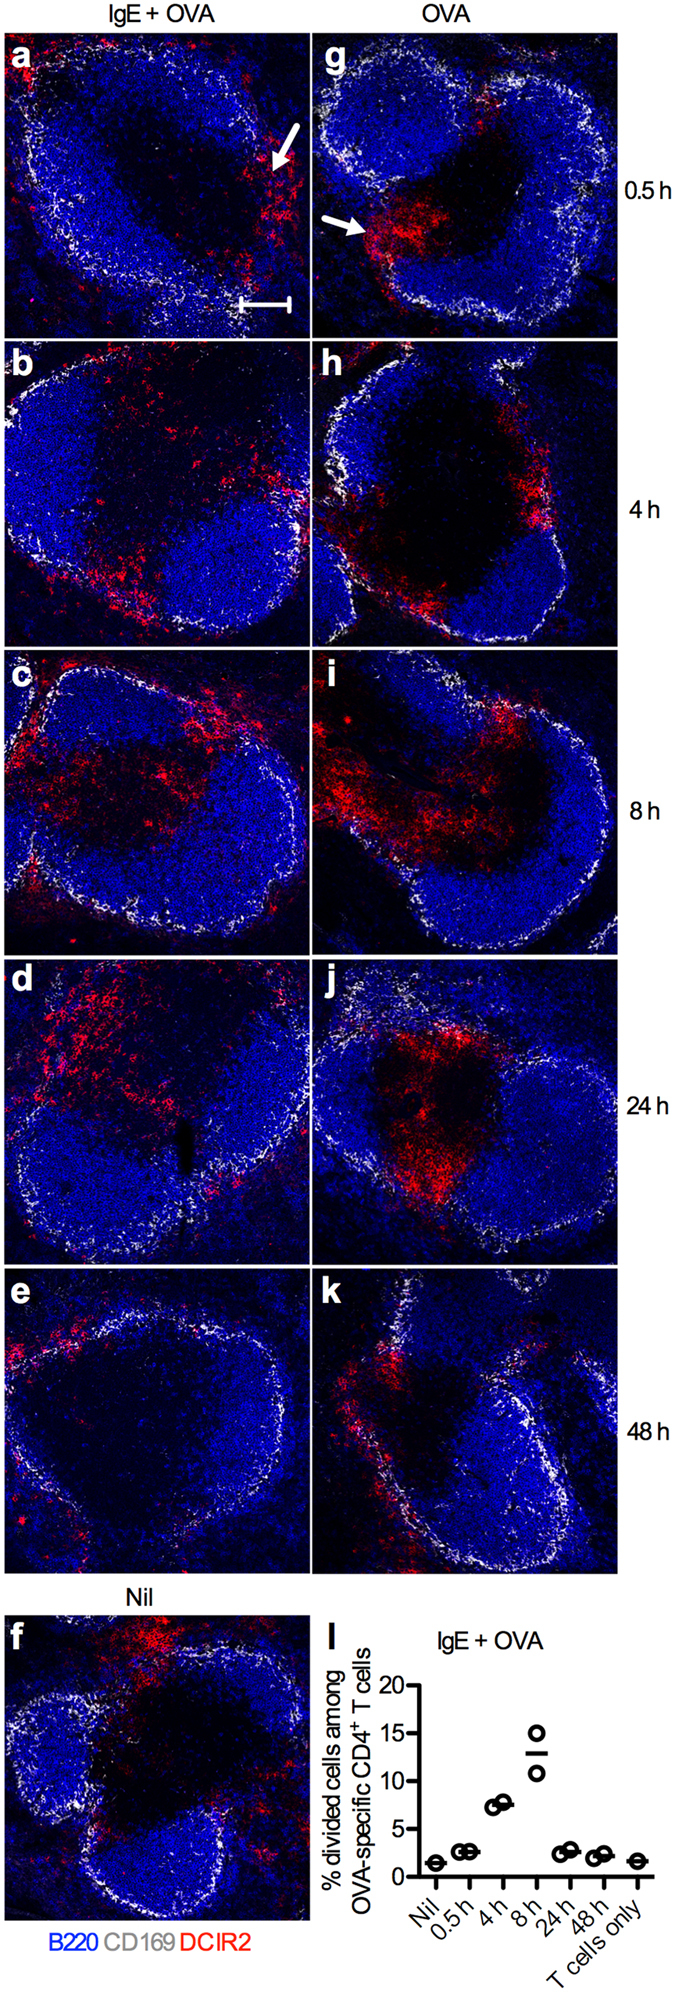
Figure 5. DCIR2+ cDCs migrate from the marginal zone bridging channel to the T cell zone after immunization.

Spleens from BALB/c mice (n = 2 per time point) immunized with 250 μg IgE anti-OVA pre-mixed with 100 μg OVA or with 100 μg OVA alone were harvested after 0.5, 4, 8, 24, or 48 h. One unimmunized mouse (Nil) was used as control. (a–k) Half of each spleen was snap-frozen and non-consecutive spleen sections were stained and analyzed by confocal microscopy. Localization of DCIR2+ cDCs in spleens harvested at indicated time points after immunization was followed. B220+ B cells, blue; CD169+ metallophilic macrophages, grey; DCIR2+ cDCs, red. Marginal zone bridging channels are indicated with arrows in (a,g). Images show representative areas (640 μm × 640 μm) of 3–4 T cell zones from 2 non-consecutive sections of each sample in every group. Scale bar represents 100 μm. Data represent one experiment where mice were immunized with IgE-OVA or OVA alone and one where they were immunized with IgE-OVA. (l) The other halves of the spleens from mice immunized with IgE-OVA complexes in (a–e) were prepared into single cell suspensions and 6 × 10⁵ cells were used as APCs in co-cultures with 105 CFSE-labeled CD4+ T cells isolated from DO11.10 splenocytes. Percentages of divided cells among OVA-specific CD4+ T cells after incubation for 3 days with APCs taken from an unimmunized mouse (Nil) or from mice immunized with IgE-OVA complexes are quantified by flow cytometry as shown in Fig. 3. CD4+ T cells cultured alone were used as negative control. Each circle represents one mouse and the lines represent the mean values.
