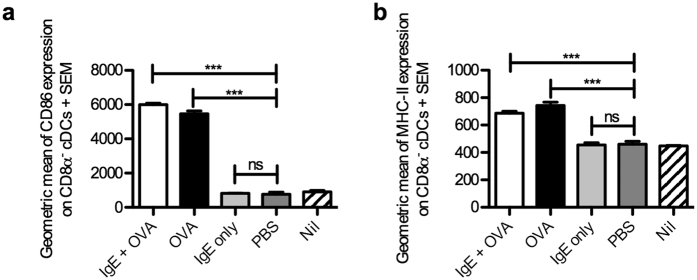
Figure 6. CD86 and MHC-II expression on CD8α− cDCs 8 h after immunization.
BALB/c mice were immunized with 250 μg IgE anti-OVA pre-mixed with 100 μg OVA (n = 3), 100 μg OVA alone (n = 3), 250 μg IgE anti-OVA alone (n = 3) or with PBS (n = 3). Mice left unimmunized (Nil) were used as negative control (n = 3). Spleens were harvested 8 h after immunization and prepared for flow cytometry analysis. CD8α− cDCs were gated as in Fig. 3a (except that MHC-II was not used in the gating strategy when MHC-II expression was quantified). Geometric means of CD86 (a) or MHC-II (b) expression on CD8α− cDCs from all groups were quantified. Data are representative of two independent experiments (except for the IgE alone-group which was only analysed in the experiment shown) and are shown as mean + SEM. Significance was determined between the groups immunized with IgE-OVA complexes, OVA alone or IgE and PBS by Student’s t-test. ***p < 0.01; no significance (ns), p > 0.05.

