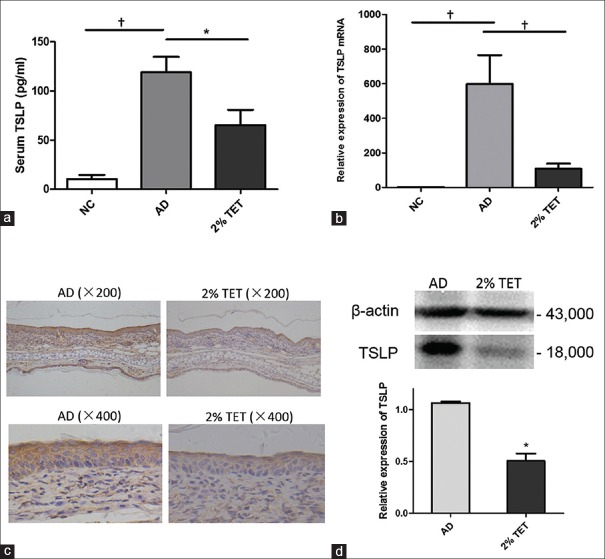
Figure 2.
Topical application of 2% TET suppressed TSLP expression. (a) Serum TSLP levels in NC group, AD group, and 2% TET group (n = 6 in each group). (b) Relative mRNA expression of TSLP in different groups and results were normalized to the expression of GAPDH (n = 6 in each group). (c) TSLP expression in AD lesion (left) and in 2% TET treatment lesion (right). (d) Expression of TSLP protein in the AD group and 2% TET group (western blot). The results were normalized to the expression of β-actin expression (n = 3 in each group). Data were expressed as a mean ± SEM (*P < 0.05, †P < 0.01). TSLP: Thymic stromal lymphopoietin; NC: Naïve control; AD: Atopic dermatitis; TET: Tetracycline; GAPDH: Glyceraldehyde-3-phosphate dehydrogenase; SEM: Standard error of mean.

