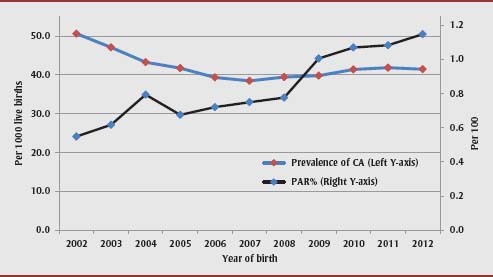
FIGURE 3. Trends in the overall birth prevalence of congenital anomalies and corresponding population attributable risk percent (PAR%), Canada (excluding Quebec), 2002/03–2012/13.

Abbreviations: CA, congenital anomaly; PAR, population attributable risk.
