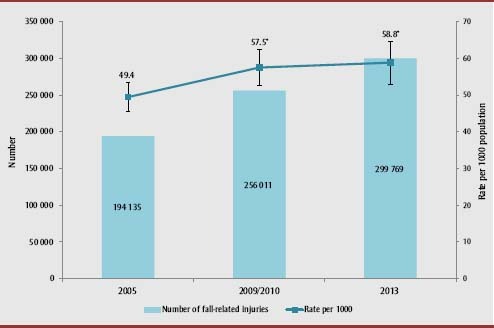
FIGURE 1. Numbers and rates of fall-related injuries, ≥ 65 years, Canada, CCHS 2005, 2009/2010, 2013.

Source: Canadian Community Health Survey (2005, 2009/2010, 2013), Statistics Canada.
Abbreviation: CCHS, Canadian Community Health Survey.
Notes: Numbers and rates (per 1000 population) of fall-related injuries were calculated using sampling weights. Error bars represent 95% confidence intervals of rates of fall-related injuries, computed using the bootstrap technique.
* Significantly different from the 2005 estimate (p < .05) based on the z-test for proportions.
