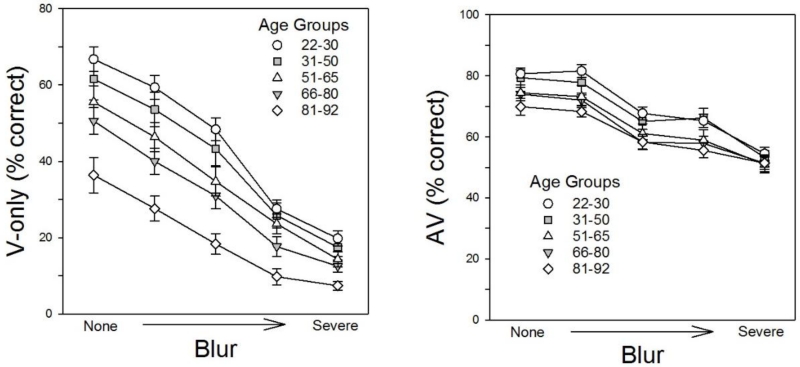
Figure 2.
V-only and AV speech recognition as a function of the clarity of the visual speech signal. The left panel shows mean performance for each age group in the five V-only conditions, and the right panel shows mean performance for each group in the five corresponding AV conditions. In both panels, the error bars indicate the standard error of the mean.

