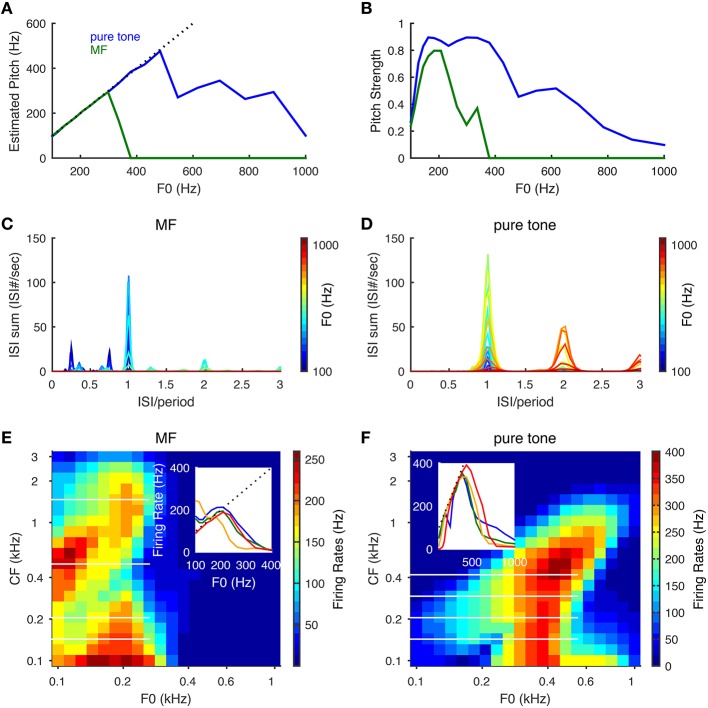
Figure 4.
Pitch frequency estimation and firing rate tuning of SD units for pure tones and MF complexes. Harmonic numbers for MF complexes are {3, 4, 5} with fundamental frequency, F0, varying logarithmically from 100 to 1000 Hz. For pure tones, F0 refers to tone frequency. (A) Estimated pitch is the same as tone frequency for pure tones (blue) up to about 500 Hz and F0 for MF complexes (green) for F0 up to 300 Hz. Dotted black line indicates equality with F0. (B) Same as (A) for pitch strength. (C) The summed ISI histograms of SD units over CF in response to MF complexes of different F0 (color coded). The x−axis is ISI normalized by the period (1/F0) of the MF complexes. (D) Same as (C) for pure tones. (E) Firing rates of SD units across CF in response to MF complexes as a function of F0. The x− and y− axes are on a logrithmic scale. Inset: representative firing rate tuning curves as a function of F0 for SD units of CFs 143 Hz (blue), 205 Hz (green), 501 Hz (orange), 1466 Hz (red). The positions of these four CFs are shown as white horizontal lines in the heat plot. (F) Same as (E) for pure tones. Inset: representative firing rate tuning curves as a function of F0 for SD units of CFs 143 Hz (blue), 205 Hz (green), 293 Hz (orange), 419 Hz (red). Results are averaged over 50 runs with independent AN inputs. Pitch and pitch strength are set to zero when the mean firing rate of all SD units is below 15 Hz.

