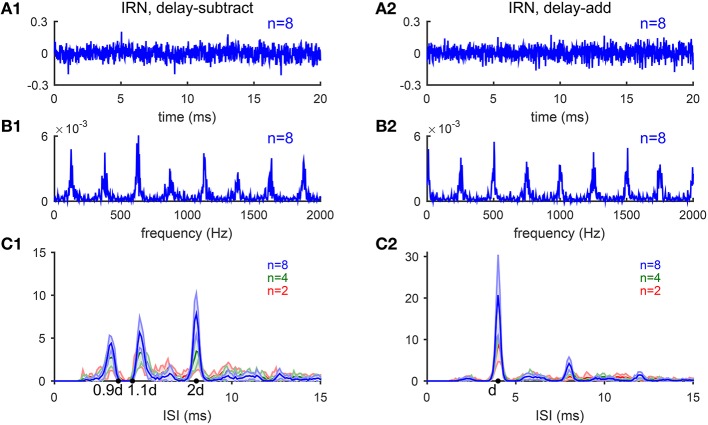
Figure 9.
Iterated-ripple-noise (IRN) stimuli generated with delay-subtract (A1–C1) and delay-add (A2–C2) operations. (A1) Waveform of an IRN stimulus generated by delay-subtract operations (gain g = −1, delay d = 4 ms and iteration number n = 8). (A2) Waveform of an IRN stimulus generated by delay-add operations (g = 1, d = 4 ms, and n = 8). (B1,B2) Spectra of the IRN stimuli shown in (A1,A2), respectively. (C1) IRN stimuli generated with delay-subtract have three peaks near 0.9d, 1.1d, and 2d in the ISI histograms summed over CF (d = 4 ms). The three peaks are of comparable heights for n = 2 (blue) and n = 4 (green), while the peak at 2d is higher for n = 8 (red). Each ISI histogram is an average of 10 realizations of IRN stimuli (shaded area is within one standard deviation). (C2) Same as C1 for IRN generated with delay-add. Only one peak at d is dominant in the ISI histograms with amplitude increasing with iteration number n (Bilsen and Wieman, 1980; Raatgever and Bilsen, 1992; Yost, 1996).

