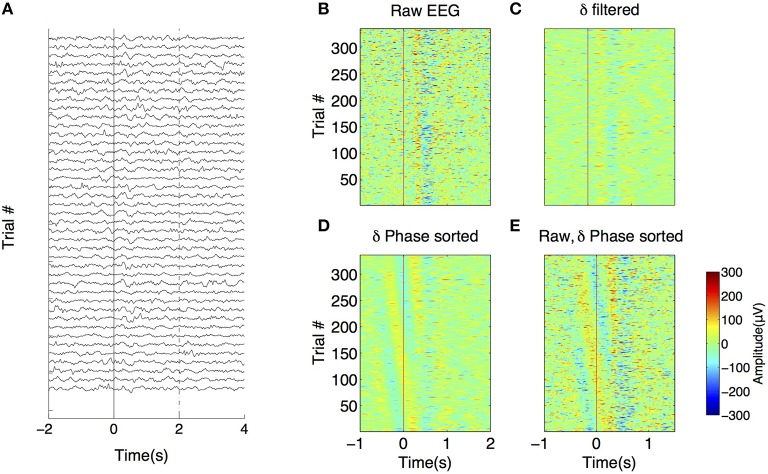
Figure 2.
Phase reset in intrahippocampal recordings. (A) EEG recorded in 40 trials from the right hippocampal electrode of patient 1. X-axis corresponds to the time relative to the presentation of the “Test” stimulus (time 0, red line). (B) False color graph of EEGs (filtered 0.1–100 Hz) from the same electrode during test presentation for the whole session. Color axis represents EEG amplitude. Note the systematic presence of a peak followed by a trough at ~200 ms. (C) Same data filtered in delta (0.1–4 Hz), (D) Same as in panel (D) but trials are sorted by increasing phase 0.1 s before stimulus onset. (E) Unfiltered recordings with trials sorted by increasing delta phase 0.1 s before stimulus onset.

