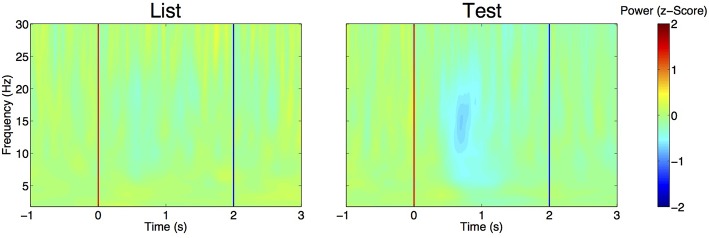
Figure 4.
Evolution of EEG power over time aligned to List (left) and Test (right) stimulus onset (red line). For each frequency band, power is expressed as a z-score, with means and standard deviations estimated from pre-stimulus baseline (–1 to 0 s) across trials. Z-scores are then averaged across trials, electrodes and patients. Note the decrease in z-score for frequencies ranging from 5 to 20 Hz at t = 0.5 to 1 s. Blue line: time at which stimulus is removed from the screen.

