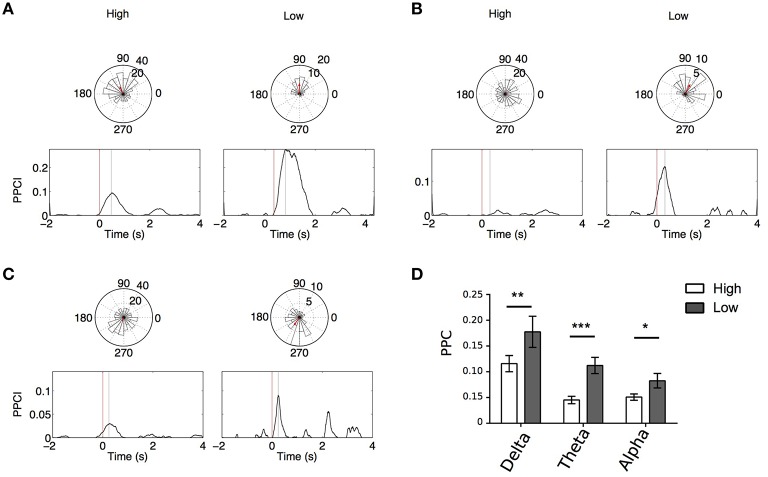
Figure 6.
(A–C) Example, for the same electrode, of PPCI progression over time in “High” vs. “Low” memory trials in delta for List trials in one patient (A); theta for List trials in one patient (B); alpha for List trials in one patient (C). Top: Phase histograms taken at the time where PPCI reached its peak (gray line). (D) Mean peak PPCI across patients between correct “Test” and “Lure” trials in the three bands. *p < 0.05; **p < 0.01; ***p < 0.001.

