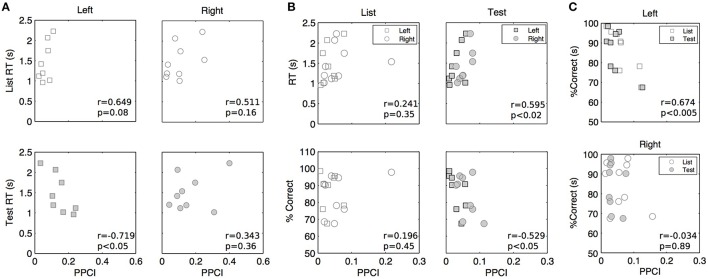
Figure 7.
Peak post stimulus PPCI vs. performance in delta (A), theta (B), and alpha (C). Each point represents peak PPCI measures for both hemispheres and stimulus type vs. performance of a given patient. Performance is computed on the basis of artifact free trials. Pearson correlation coefficients (r) and associated p-values are shown for illustrative purposes.

